Proceedings of THE THIRD ANNUAL RALUT SENIOR SCHOLARS SYMPOSIUM
Massey College
University of Toronto
April 10, 2008
Edited by Cornelia Baines
Toronto Retired Academics and Librarians of the University of Toronto (RALUT) 2008
Contents
Introduction
The Presenters
The US Hegemon and its North American Periphery
Policies That Value Water: An Overview
G8 Accountability: THe Civil Society Effect
Interest and its Link to to Self-Regulation
Screening for Cancer: Are We chasing an Elusive Dream?
Planet Earth's Deeper Water Cycles
On The Years of the Highest High and the Lowest Low Daily Temperatures
Antarctica and Human Biology
For the second time, RALUT is publishing papers presented at its annual Senior Scholars Symposium. These proceedings include eight papers presented at Massey College on April 10, 2008.
The range of topics and the academic excellence that the papers reveal are impressive, illustrating well the ongoing contributions of retirees to the academic life of the university in particular and intellectual life in general.
The symposium was initiated in 2006 by RALUT's Senior Scholars' Committee chaired by Germaine Warkentin. That it has been so successful is a tribute to the organizing subcommittee which in 2008 included John Dirks, Merrijoy Kelner and John McClelland.
But RALUT must also express gratitude to those who agreed to speak! Doing so meant that they were obliged to submit manuscripts so that we could publish them in the proceedings. As a result they had to put up with editorial demands for clarification and references. They did this with very good grace and for that they deserve many thanks.
Furthermore we were honoured that The Honourable Adrienne Clarkson agreed to be our featured guest and that we could enjoy her reminiscences of university life.
Finally RALUT must acknowledge our good fortune in being able to hold these symposia in the Upper Library of Massey College where not only intellectual exchange thrives, but also a wonderful ambience can be enjoyed. As current chair of the Senior Scholars' Committee and so-called editor of the proceedings, I am obliged to say that without the expertise of Ken Rea, we would have no proceedings. Now we can only hope that our readers will enjoy the fruits of our labours.
Cornelia Baines
Stephen Clarkson:: Departments of Political Science.
Lino Grima : Centre for Environment & Geography.
Peter I. Hajnal : Faculty of Information Science.
Suzanne Hidi : Department of Laboratory Medicine and Pathobiology.
Anthony B. Miller : Department of Public Health Sciences, Faculty of Medicine.
Pierre-Yves Robin : Deparment of Geology..
John W. Senders : Faculty of Applied Science and Engineering.
Becky A. Sigmon : Department of Anthropology.
Stepen Clarkson
Introduction
At a time of military failure abroad and economic collapse at home, questions about US power are being asked with new urgency. While commentators in the media have little trouble pointing out that the emperor has no clothes, the discipline of international relations (IR) is largely stuck in a one-sided view of the United States which focuses on its six decades of global dominance.
The voluminous IR literature on the United States has two prime characteristics. US power is measured quantitatively to compare it with that of its actual or potential rivals. It is also discussed instrumentally in terms of whether it is exercised unilaterally by American decision-makers or multilaterally within international organizations. In either case, US power has been largely taken as a given, the independent variable whose massive material assets explain its capacity to shape events around the world. Understood as the master of its own capabilities, Washington's problem is presented as how to apply them: either exercising its will by imposing its hard power or working collaboratively using its soft power.
I am proposing to invert IR's default mode by establishing a matrix to determine how the United States' international partners contribute to (or constrain) its international efficacy. Whereas IR literature has traditionally focused on the United States as the international order's subject whose massive material assets explain its consequent capacity to affect the world outside its borders, my approach considers the United States as object: that is, how its present power is a function of the substantial control it has acquired over other states' resources in the past and of its capacity to mobilize their moral and material support in the present.
As I am more a scholar of North America's political economy than an analyst of international relations as a whole, my inquiry's principle interest is to answer a new question about the continent: How does the United States' immediate periphery, Canada and Mexico, contribute to or constrain American power? This query can be restated by posing the counterfactual question, “In what ways and to what degree would US power be reduced (or enhanced) if Canada and Mexico did not exist on its northern and southern borders?” To answer this question I propose to address three related propositions that explore the three major vectors of US power – material assets, relations, and global structures. My ten cases will provide probes into the most salient issues relevant to each proposition so that an interested public in each of the continent's three countries will have a transformative understanding of North America's geopolitical dynamics.
US Material Power: Proposition A. In terms of their economic, human, and resource contributions, Canada and Mexico are the most important external sources of US material power. This first part of the study will evaluate four dimensions of the periphery's contributions to US economic strength.
1. Aggregate trade and investment data will be marshalled to identify how much the two peripheral economies contribute to US GDP, e.g. by expanding its market, creating jobs, and so raising its size and productivity.
2. Sectoral production networks. Case studies in a key industry (steel), a vulnerable manufacturing sector (automobiles and car parts), and a central services sector (banking) – will illustrate how the periphery can bolster and limit US corporations' scope and success.
3. Labour flows. Migration data will document how well-trained Canadian brains and low-cost Mexican brawn provide a flexible labour supply to meet US needs.
4. Energy and resource supplies. The contribution to US resource security and stability of oil, gas, and electricity flows from the periphery will be documented.
US Relational Power: Proposition B. Geography makes Canada and Mexico the chief providers of US border security, but history caused their support for US military power to diverge. Since US hard power is a function of American defence capacity, this part of the study will consider the periphery's participation in (or abstention from) three facets of US relational power.
5. Border security. The periphery's role in providing American security will emerge from assessing a range of smart-border initiatives introduced since 2001.
6. North American defence. Canada supported and Mexico resisted contributing to US continental defence through cooperation with the Pentagon's Northern Command.
7. The US war on drugs. Canada's lesser and Mexico's greater roles as producers and conduits of addictive drugs for the enormous American market are contradictory. While drug cartels arguably undermine US power, the two governments have cooperated with Washington to restrict these suppliers thereby buttressing US power.
US Structural Power: Proposition C. Canada's and Mexico's multilateral contributions to building the norms of the world order have had both intended and unintended effects on US structural power. This final part of the study will investigate three ways that the periphery impacted the United States' structural power through constructing global governance regimes which in some cases project and in others restrict its influence overseas.
8. Global multilateral regimes. With the International Criminal Court, the Responsibility to Protect doctrine, and UNESCO's convention on cultural diversity, Canada led an effort to forge governance norms that might constrain the United States while Mexico was reluctant. Within the effort to construct a global climate change regime, Canada supported the Kyoto accord at first but then buttressed Washington's efforts to undermine this embryonic international regime.
9. International diplomacy. Mexico took the lead in resisting US intervention in Castro's Cuba and opposing the Reagan administration's militarization of civil conflicts in Central America, thereby buttressing an international structure centred on the norms of sovereignty and non-intervention. To this end, Canada supported Mexico's Security Council efforts in early 2003 to resist US efforts to have the United Nations endorse a military attack on Iraq.
10. International economic order. In contrast, Canada supported and Mexico resisted the post-World-War-II construction of multilateral economic institutions that framed US global hegemony. Canadian and Mexican negotiation first of continental free trade and then their own bilateral trade and investment treaties propagated economic norms deepening US structural power.
Relation to my previous work
When I left Sovietology behind, my primary interest became the political economy of Canada, in particular the various dimensions of the country's integration in a North America then made up just of the United States and Canada. When, in the mid-1990s, NAFTA created a new world region, my teaching and research extended to embrace this continental governance in the context of the global structure created by the WTO at the same time. My present project will complete a trilogy of large studies that I have conceived on relations within this new North America. Uncle Sam and Us: Globalization, Neoconservatism, and the Canadian State took Canada as the dependent variable by examining how exogenous forces (globalization) and endogenous change (neoconservatism) affected the Canadian state's policy capacity. In October 2008 I published a broad study (made possible by my last SSHRC grant) with the University of Toronto and the Woodrow Wilson Presses Does North America Exist? Governing the Continent after NAFTA and 9/11– which takes North America as the dependent variable by looking at how US, Canadian, and Mexican actors generate transborder governance. My new project will culminate over a decade's work on North America by taking the USA as the dependent variable.
In reframing North America's space in terms of its political-economy realities, it is imperative to understand Mexico's part in the new North America in which it plays an important, if not always optimal role. For linguistic as well as logistical reasons, much scholarship on North America that is knowledgeable about Canada fails to appreciate Mexico's unique effects. This is why I have spent a month or two each winter for the last three years in some of Mexico City's best research centres to make my work sensitive to that country's reality and why I will need to return there as my work proceeds.
With US power now being challenged economically, militarily, and normatively, blithe assumptions about American supremacy are no longer analytically useful. These empirical studies, which will show how US power is constructed and constrained by its neighbours, should prove relevant to both the academic and policy-making communities.
Academia. This study's expected contribution will be to develop the notion that US power is not a finite given but is, in part, generated from outside the United States' territorial confines. Once successfully applied to Canada and Mexico, this methodology could be extended and adapted to other countries in order to establish a more complete inventory of the external sources of US power. Closer to home, the very substantial literatures on Canada-U.S. and the Mexico-US relationships have each tended to take its particular dyad as a “special” – putatively unique – international relationship. Only recently have efforts been made to compare Canada's US relationship with that of Mexico's. The comparative study of Canada and Mexico is a new research niche which opened up with the signing of NAFTA. My project will reframe this new literature comparing the two US neighbours by looking at them as agents instead of objects in intergovernmental relations on the continent.
Policy-makers. I hope that this study, which coincides with great intergovernmental instability, will contribute to policy makers' rethinking old continental realities in Washington, Ottawa, and Mexico City. Insight into the components of US power is clearly necessary at this historical juncture when the United States is no longer sitting, unchallengeable, at the pinnacle of power in the international system but is increasingly dependent – as Barack Obama has frequently pointed out – on its partners' support, both material and moral. For instance, by specifying how the continental periphery contributes to US power, my findings on North America's intergovernmental supports should help Canadian and Mexican leaders decide how to distribute their power resources between the continental and the global levels as their two countries balance centrifugal corporate pressure for continental regulatory integration against the centripetal political needs for autonomy and decentralization.
While it is commonly believed that Canada and Mexico matter very little to Washington as it faces far more urgent global challenges, there are significant links between the continental and the global which contradict that assumption. With Indian and Brazilian companies buying large chunks of the Canadian steel and mineral industries and with China wanting entry into the Mexican petroleum economy, US policy makers must interrogate their assumptions about the United States' assured access to the continent's resources.
Summary
Since the United States' invasion of Iraq, its pre-eminence in the international system is being re-examined in terms of its hard military capabilities. The collapse of its financial institutions has re-animated discussions about the extent of United States' soft global power. A striking aspect of this debate is how little attention is paid to the way in which US power is constituted. Apart from reports that assess the US economy's dependence on foreign providers of strategic raw materials – most importantly petroleum – the literature on US hegemony has been built on the implicit assumption that Washington is the sole creator of its own capabilities. Academic and policy studies generally examine the extent of US power and how it is best applied abroad, without considering the extent to which it derives from external sources.
Over the past eight years I have been working on North America's political economy by asking to what extent it has become a world region in any way similar to the substantial entity known as the European Union that has been created over the past 50 years. In my new work I am inverting the way that US power is generally discussed by considering to what degree Canada and Mexico construct (or constrain) the United States, either because of their geographical contiguity or their unique socio-economic characteristics. Integrating both international relations and political economy approaches, I am using ten case studies to assess the complex ways in which the United States' strength derives from its continental periphery. These probes, which range from energy supplies to international legal norms, will explore three related propositions.
1. Through their economic, human, and resource contributions, Canada and Mexico are the most important external sources of US market power.
2. Canada and Mexico provide crucial border security to the United States, though they have played a more mixed role in supporting US military power.
3. Uncle Sam's two neighbours have helped build the norms and international structures that support US economic power but potentially circumscribe US global power militarily through the International Criminal Court and culturally at UNESCO.
Beyond the academic goals of reassessing the sources of American power and advancing comparative political-economy scholarship in Canada and Mexico, this research promises to have some intriguing implications for policymakers.
In sum, I am hoping to contribute both to academics' conceptualizing and policy makers' understanding of the new realities of post-NAFTA, post-9/11 North America and of the special role played by Canada and Mexico in constituting American power in the present conjuncture when the global hegemon's leadership is under strain.
Policies That Value Water: An Overview A. P. Lino
Grima University of Toronto
Centre for Environment & Geography
Introduction
Canadians need to re-think their perception of plentiful water and more importantly, we need to reconsider our profligate use of water, especially in the context of global warming The average per capita municipal water use in Canada is 622 liters per day, more than double the average in European cities (1,2). To some extent Canadians' misperception of water abundance is understandable: Canada has about 7% of the earth's land surface, about 7% of the earth's renewable freshwater but only 0.5% of the world's population (3,4). However, most of our rivers flow north, away from the thin ribbon of settlement at the 49th parallel and there are spatial and temporal variabilities that leave some parts of Canada, such as the Prairie Provinces, vulnerable to serious and recurring droughts. These recurring shortages will be exacerbated by global warming and the vast amount of water required to produce more energy from the Tar Sands projects in Alberta (5).
The highly significant economic benefits that water provides for our industry, cities, hydro-power generation, irrigation, forestry products and tourism are amenable to quantification but the techniques are controversial, because water is only one input to economic production and it varies widely over time and space (6-8). Other benefits related to ecological services (e.g. maintaining wetlands) are harder to quantify (9).
Canadians' profligate water use may be due to a perception of abundance rather than an indication that Canadians do not value our water inheritance. However if our water use pattern is:
one then must conclude that Canadians collectively either do not value our water inheritance or have failed to develop appropriate water policies.
This paper briefly outlines some policy options that demonstrate that the community values its water, even as it confronts the twin imperatives of ensuring sustainability while exploiting our comparative economic advantage accruing from plentiful water. These policies are likely to become more salient as population size increases, living standards rise, water-demanding energy projects proliferate, climate warming reduces runoff and conflicting demands (e.g. for irrigation vs. industry) increase.
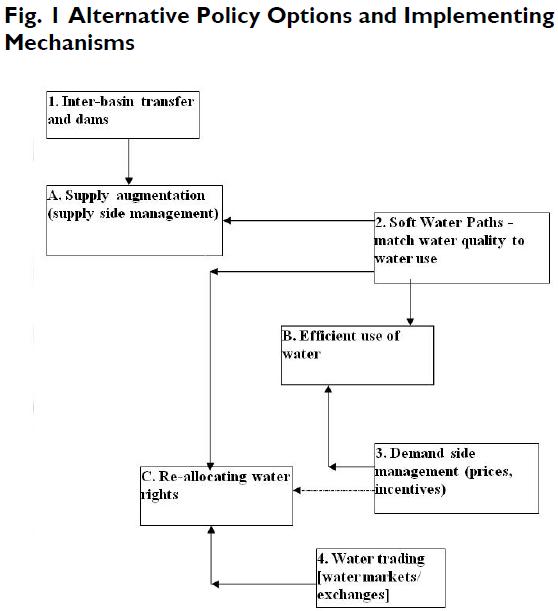
All communities need to develop effective policies to cope with water shortages, increasing demand and competition such as for farming vs. tar sands projects in Alberta. Failing that, policy options such as restrictions on irrigation or urban water services become inevitable. Given initial (current) water uses, rights and institutions, Figure 1 lists three broad coping options: (A) supply augmentation; (B) more efficient use of the available water; and (C) re-allocation of water-use rights. Figure 1 links each option to one or more of four policy mechanisms.
Supply Augmentation
Supply augmentation or supply-side management (option A in Fig. 1) has been the conventional way to cope with real or perceived shortages, not only in the case of water but also in other natural resource and infrastructure issues such as electricity, petroleum, roads, and solid waste management. In spite of increasing financial cost and negative environmental and social impacts, supply augmentation is very appealing. It facilitates "business as usual" by giving more of the same to business and individual consumers without asking for changes in wasteful habits reinforced by past growth, profits and convenience. And as long as it works, it is likely the best route to take, with the proviso that the users of the water or electricity or roads or gasoline face the full cost of producing the service that they use. Most of the time there are environmental and social costs of such services, such as air and water pollution; displacement of population when dams are built; noise; and global impacts such as the destruction of the ozone layer by chlorofluorocarbons and the increasing concentrations of carbon dioxide in our atmosphere. Economists refer to these costs as externalities, i.e. negative impacts that are not paid for by the beneficiaries of the activities that cause these impacts.
Increased Efficiency
In the case of water, the most conventional way to increase supply is by increasing storage of run-off in dams to produce hydro-electricity, provide urban water for residents, commerce, industry and farming, enhance recreation opportunities, and reduce flood damage. Other modes of supply management are inter-basin transfers via pipelines (e.g. the London, Ontario, pipeline from Lake Huron), drinking water treatment plants and storage towers in cities. In addition to the need to address the externalities of such projects, 20 developing new water sources is likely to become increasingly expensive because the more accessible and least expensive sources have very likely been exploited already. “Business as usual” is not a habit likely to be given up easily in our societal context where engineering works are generally considered manifestations of progress and civilization. However increasing economic, social and environmental costs of supply-management will make other options for coping with water shortages more appealing.
Increased Efficiency One can increase the efficiency of conventional water resources (option B in Fig. 1) in two ways: the use of demand-side management incentives (policy mechanism 3 in Fig. 1) and the use of the newly emerging water soft path (policy mechanism 2) which is defined below.
The literature on water demand management goes back to the late 1960s and early 1970s, largely as a response to wasteful municipal and irrigation water uses (10,11). For example, municipal water users typically face low water rates. And in a well functioning economic system, one would not argue with affordable, low cost water where the full costs of supply are covered by users. For the past five decades the consensus has been critical of water rates that do not reflect correctly the full cost of water, and therefore give incorrect signals to consumers and encourage wasteful uses. (For useful reviews see 12, 13.) For example many cities in Canada and the US do not meter individual homes (3) and none meter individual units in high-rises. In this case the consumers are given the signal that it does not matter how high or low their water use is – certainly not a signal to use water wisely and avoid waste!
Nearly all municipalities in Canada have declining block water rates, i.e. the first block of water use has a higher per unit cost than the next, thus the unit cost of water decreases as residents use more water in their homes and gardens. Although this is better than an unmetered water service, it does not provide a compelling incentive for the consumer to reduce water use. Municipal water rates should accurately reflect the increasing cost of supplying water to the user. This could be accomplished by increasing the block rate, i.e. increasing the unit cost with increased volume. This approach also makes it possible for low-income consumers who are not likely to demand a lot of water, to enjoy a basic water service at the lowest rate.
In addition to more appropriate water rates, public education, full cost pricing, labelling large water-using appliances such as washing machines, and changing building codes to require low-flow toilets and showers are other policy options to increase water-use efficiency. The draft changes in the Ontario Permits to Take Water (pursuant to the Ontario Clean Water Act and the Safeguarding and Sustaining Ontario's Water Act) go even further by requiring municipal water audits.
A second way to increase the efficiency of conventional water resources is to adopt water soft policies to meet increasing water demands (policy mechanism 2 linked to options A and B in Fig.1). The water soft path is analogous to the soft energy path (14). With this approach we match water quality to its proposed use. For example, water for cooling in industry, flushing toilets or irrigating golf courses does not need to meet potable standards. Water soft policies focus not so much on the resources (in this case water) but on the service that the water is meant to satisfy. Matching the service with a quality of water broadens the range of policy options from the conventional engineering approach of building more dams and pipelines and digging deeper wells to making better use of the available water. Thus water soft options can increase the amount of water available for use. If gray water is used to water gardens and golf courses instead of being piped to the sewage treatment plant, the amount of water available to the municipality is increased without the need to build yet another dam or dig another well.
Conventional water planning recognizes that water soft path options increase the efficiency of conventional water. However there is another conceptual component of water soft analysis that sets it apart from conventional 'efficiency' approaches. As Brooks (15) notes, the water soft path approach turns “typical planning practices around… Instead of starting from today and projecting forward, start from some water-efficient future and work backwards (“backcast”) to find a feasible and desirable way between that future and the present.” The future in this approach is “normative in the sense that environmental sustainability plus social and economic equity” are not just desirable but required objectives. Sustainability and equity become central to the analysis. This hitherto under-tilled field holds great promise for both research and application.
Re-allocating water rights (Option C)
Standards, regulations and guidelines restrict the use or disposal of water; failure to comply carries the threat of prosecution. Prices, charges, taxes, subsidies and similar economic incentives (positive or negative) impose specific costs on the use or disposal of water but, unlike regulations, offer more flexibility to users of water. For example, one could pay more to use more water or even pay to have others clean up ones pollution. Under regulation and economic incentives, rights to use water may be limited, crimped, and made more costly. In contrast, another policy is to re-allocate the right to use water among users.
There are two legal principles for allocating water rights in North America. In the eastern and wetter half of North America, the customary English “riparian right” applies. Under this legal regime, the owner of land fronting a river has to allow the flow to the downstream neighbour undiminished in volume and quantity. The “riparian right” of the neighbours imposes a riparian obligation on each water user. Government may issue permits-to-take-water, which are not transferable and may be changed or revoked at the discretion of the appropriate agency.
In the western part of the U.S.A. and Canada, where water is clearly limited, the doctrine of “prior appropriation” prevails. Under this legal regime, the government allocates water rights on a “first-in-time, first-in-right” basis. The water rights are most often linked to land ownership. This legal regime for water rights was crucial in attracting settlers to the frontier. A common feature of prior appropriation is that if the water is not used, the allocation is lost, a kind of “use it or lose it” approach – hardly an incentive to reduce ones water use! To provide an incentive to use water more efficiently, some jurisdictions (e.g. in the Murray-Darling basin in Australia), allow owners of water rights to trade their rights to other users through a water rights exchange, analogous to the financial stock exchange.
Under a regime of prior appropriation, banning trading does not provide an incentive to increase water-use efficiency because there is no market for any “saved” water. If trading water rights is allowed, water is used more efficiently by the entry of junior rights owners and the general adoption of more efficient technologies that create the “saved” water in the first place. However water use does not necessarily decrease when water trading is allowed. Whether the total water use increases or not depends on the added demand of the new water rights holders. For example, in southern Alberta, water use may increase if oil companies buy quotas from water-rights holders who were not fully using their quota (5).
The costs associated with trading water rights include the administrative costs of legally defining water rights and of monitoring and enforcing trades; and infrastructure costs required by an expanded network of water users. Gains include the value of the new economic activities of the new users of the traded water. Gains are more likely to exceed costs when water is scarce and therefore more valuable (16). Examples of formal water trading on water rights exchanges are not many but there are functioning markets in the Central Valley of California, Chile, South Africa and the Murray River Basin of New South Wales (17, 18).
Challenges in Implementation
As noted in the Introduction, computing the value of water is very challenging, partly because it has so many different uses and its quality and quantity vary over space and time and partly because there are so many personal preferences (e.g. sustaining wildlife vs. golf) to take into account. A more pragmatic approach is to focus on three overlapping policy questions:
While the value of water to society is crucial and evident, optimal policy mechanisms are often not simple, transparent, equitable or efficient because water is the most common commodity almost everywhere and it is easily taken for granted. As a result, even basic information on water supply and use is often not available. For example, 1996 is the last year for which water use data across Canada has been published. Strong support for water supply and demand data and research are basic to a much needed federal interest in developing a Canadian water strategy (19).
Another challenge is that a one-size-fits-all approach does not work well. The best approach is to base each decision on detailed research on the individual case. For example, some municipalities have tried to reform their water rates with insufficient information about consumers' price response and were faced with declining demand to the point that their total revenues fell short of expenditures. Part of the cost of implementing reform is the cost of developing detailed information on a case-study basis.
Economic conditions and water supply/demand circumstances change and information is often missing. Therefore it is advisable to espouse 'adaptive management' (20) in water policy reform implementation. Adaptive management is based on (a) systematic monitoring of the effects of the implemented policy (b) continuous striving for outcome evaluation and (c) changing policy based upon the updated information. It involves adopting a science-based policy mechanism with the realization that the policy maker does not have complete information about how the policy will work out but is brave enough to find out and committed to learning from the process.
Al Gore's prognostications in his book Inconvenient Truth (21) will, one hopes, not become reality. However it is best to be prepared for the day when policy makers and legislators have to decide who will have the right to access a water resource, under what constraints, for which purpose, at what time and for what price. The policy options presented in this paper have been adopted in other jurisdictions, where progress has not been uniformly smooth but encouraging. It behoves us to learn how demand-side options and water soft paths work out and how they could be applied in Canada, where supply-side management is still the dominant, conventional policy response to real or perceived water scarcity.
Acknowledgements: The Atmospheric and Climate Research Directorate, Meteorological Services Canada, financially supported research on the international experience in policy options that reflect water values. Olivia Wong, a co-op student in Environmental Science at the University of Toronto Scarborough Campus, was a very productive research assistant. Rodney White, Heather Auld, Don MacIver and Grace Koshida made many constructive suggestions. The author is responsible for all observations and conclusions.
1. Environment Canada (2004). Municipal Water Use Report – Municipal Water Use: 2001 Statistics.
2. Brandes, O., K. Ferguson, M. M'Gonigle, C. Sandborn (2005). At a Watershed: Ecological Governance and Sustainable Water Management in Canada. Victoria, B.C.: Polis Project on Ecological Governance.
3. Environment Canada (2004). Threats to water availability in Canada. Burlington, Ontario: National Water Research Institute NWRI Scientific Assessment Series No.3 and ACSD Science Assessment No.1.
4. Sprague, J. (2007): 'Great Wet North', in Bakker, K. (ed.), Eau Canada: The Future of Canada's Water. Vancouver: UBC Press.
5. Alberta Environment (2003). Water for Life: Alberta's Strategy for Sustainability. Edmonton: Alberta Environment.
6. Grima, A.P. Lino (2006). “Will Canada's Well Run Dry?” idea&s (the arts & science review) vol. 3, number 1, Spring 2006, 42-43.
7. Aguelo, J.I. (2001). The economic valuation of water: principles and methods. Value of Water Research Report Series No.5. Delft: International Institute for Infrastructural, Hydraulic and Environmental Engineering [IHE].
8. Turner, R.K., Pearce, D. & Bateman, I. (1993). Environmental Economics: An elementary introduction. Baltimore: The Johns Hopkins University Press.
9. Freeman III, A.M. (1993). The measurement of environmental and resource values: Theory and methods. Washington, D.C.: Resources of the Future.
10. Hirshleifer, J., J. DeHaven and J. Milliman (1960). Water Supply: Economics, Technology and Policy. Chicago: University of Chicago Press.
11. Grima, A. P. (1972). Residential Water Demand: Alternative Choices for Management. Toronto: University of Toronto Press.
12. Brooks, David B. and Roger Peters (1988). Water: The Potential for Demand Management in Canada. Ottawa: Science Council of Canada.
13. Tate, D. M. (1990). Water Demand Management in Canada: State of the Art Review. Ottawa: Social Science Series No. 23, Inland Waters Directorate, Environment Canada.
14. Lovins, Amory B. (1977). Soft Energy Paths: Toward A Durable Peace. Cambridge, Mass.
15. Brooks, David B. (2005). Beyond Greater Efficiency: The Concept of Water Soft Paths, Canadian Water Resources J. vol. 30 (1) 83-92.
16. Zilberman, David and Karina Schoengold (2005). The Use of Pricing and Markets for Water Allocation, Canadian Water Resources Journal, vol. 30 (1), 47-54.
17. Haddad, B.M. (2000). Rivers of Gold: Designing Markets to Allocate Water in California. Washington,D.C.: Island Press.
18. Horbulyk, T.M. (2007). Liquid Gold? Water Markets in Canada in Bakker, K. (ed.) EauCanada. Vancouver, B.C.: UBC Press, pp. 185-204.
19. Morris, T.J., D.R. Boyd, O.M. Brandes, J.P. Bruce, M. Hudon, B. Lucas, T. Maas, L.Nowlan, R. Pentland, and M. Phare (2007). Changing the Flow: A Blueprint for FederalAction on Freshwater. Ottawa: The Gordon Water Group of Concerned Scientists and Citizens.
20. Holling, C.S. (ed.) (1978). Adaptive Environmental Assessment and Management. London: John Wiley & Sons.
21. Gore, Al (2006). An Inconvenient Truth: The Crisis of Global Warming. New York: Rodale and Viking.
G8 Accountability: THe Civil Society EffectPeter I. Hajnal
Introduction
This paper examines the democratic accountability of the G8 with a particular focus on the role of civil society. It outlines for what and to whom the G8 is accountable; analyzes how and to what extent civil society engagement has, and has not, promoted G8 accountability; and reviews civil society interaction with the G8 and the effects of this nexus on the G8 accountability, reviewing various factors that have helped or hindered civil society's contributions to that end.
What is the G8?
Despite huge publicity surrounding the annual summits, the Group of Eight remains relatively little understood outside specialist circles. The G8 comprises what are usually called the major industrial democracies: Canada, France, Germany, Italy, Japan, Russia (with reservations about its democratic credentials), the United Kingdom, and the United States.
The G8 is an informal forum of global governance, distinct from international organizations based on a charter or other intergovernmental agreement, such as the United Nations (UN) or the World Trade Organization (WTO). Nor does it have a secretariat to carry on day-to-day implementation of policy decisions. Due to this lack of a formal framework, it has no mechanisms to regulate its relations with other actors.
But these limitations have not prevented substantial interaction between the G8 and civil society.
The origins of the G8 go back to several shocks to the world economic system in the early 1970s, notably the collapse of the Bretton Woods international monetary system based on fixed exchange rates and the quadrupling of oil prices by OPEC (Organization of the Petroleum Producing Countries) in 1973-74. To respond to these shocks, finance ministers from France, Germany, Japan, the UK and the USA began in 1973 a series of meetings. These led to summits of the leaders of these countries with the objective of reaching policy agreements in respect of the common challenges (1).
The first summit of the original five plus Italy was held in 1975 at the Château de Rambouillet, near Paris. Canada joined the club in 1976 to form the G7, and the European Union has participated since 1977. In 1998 Russia became a full member, creating the G8. More recently the leaders of five major emerging-economy states (Brazil, China, India, Mexico and South Africa) have joined parts of the summit proceedings; this configuration was first called the “G8+5”; in 2007 the “+5” were renamed the “Outreach 5” (“O5”).
The functions of the G7/G8 have also expanded over time. The main roles today, according to John Kirton, are deliberation, direction-giving, decision-making, and management of global governance and domestic politics (2). The summit allows the attending heads of state and government to exercise political leadership, reconcile domestic and international concerns, develop collective management, and integrate economics and politics in their negotiations and decisions.
Each G8 leader has a support apparatus led by a personal representative, known as a “sherpa”, and his team of two “sous-sherpas” (one for economic affairs and the other for financial matters), a political director, as well as logistical, security and other staff. Since 2001 each leader has also had an Africa Personal Representative. In the early years, delegations included the foreign and finance ministers, but following the organizational innovations of the 1998 Birmingham summit these ministers were detached from the leaders' summits and they now hold their own meetings which feed into the leaders' summits. These and other ministerial fora also hold their own series of meetings throughout the year. The G7/G8 has also created various task forces, expert panels and working groups, some of which have later expanded their membership beyond the G8 and developed quasi-independence.
G8 Accountability
The term accountability is used here in the sense of an actor's answerability for its actions or inactions to those who are affected by such actions and inactions. The issue of G8 accountability – particularly its democratic accountability – has received relatively little attention (3), yet the charge is often levelled that the G8 is not accountable. Accountability can be said to have the principal aspects of transparency, consultation, evaluation, and opportunities to redress wrongs or omissions.
For what is the G8 accountable? After the economic and financial focus of the early summits (1975-81), the agenda expanded substantially. Political and security issues became increasingly prominent in the period 1982-88. From 1989 other global issues were added: democratization, the environment, terrorism and transnational organized crime, development, poor country debts, infectious diseases, migration, food safety, energy, education, intellectual property, corruption, and various armed conflicts. The G8 can therefore be held to account for its actions and inactions in all those areas.
To whom can the G8 be held accountable? The stakeholders include the eight member governments and their citizens, and the global community as a whole, including marginalized groups. Mutual accountability also operates, with the G8 demanding others to answer to it at the same time that it answer to them.
There is relatively strong internal accountability within the G8 system; the leaders answer to their peers. When, at a summit, they undertake before their peers to accomplish a particular objective, they must again face those colleagues at future summits should they not comply with their commitments. As well, task forces and other subgroups must report back to the leaders or ministers when asked to do so.
As elected heads of state or government, individual G8 leaders are accountable to their own constituencies. This is fulfilled, for example, by regular post-summit reports given by UK prime ministers to Parliament or the Canadian government's follow-up reports on G8 initiatives on Africa. As well, host governments are accountable for public money spent on organizing summits and other G8-related actions. But on the whole G8 accountability through national elected legislators is still insufficient.
The G8, arguably, is also accountable to the global community as a whole since it is an instrument of global governance addressing global issues. The G8 leaders have undertaken to provide global public goods for the benefit of all. But even with the addition of Russia in 1998 and the “+5”/“Outreach 5” since 2005, the G8 is anything but representative of overall humanity. Inadequate representation has compromised G8 accountability (and perhaps legitimacy) (4). Several recent proposals have sought to remedy this imbalance. One initiative, advocated by former Prime Minister Paul Martin, would turn the G8 into an L20 (Leaders' 20) patterned on the G20 finance ministers' forum, but with a broader global agenda. Another proposal would incorporate the “Outreach 5” as regular members of an enlarged G13.
One way the G8 attempts to fulfil its accountability to wider humanity is by interacting with regional and global governance agencies. For a number of years, the G8 leaders have invited the administrative heads of international organizations to the summits for consultation: the UN Secretary-General, the Managing Director of the International Monetary Fund, the heads of the World Bank, the OECD (Organisation for Economic Co-operation and Development), the International Energy Agency (IEA) and the African Union. On issues where the G8 is unable or unwilling to act decisively, it tends to remit the task to an IGO (International Governmental Organization), for instance, by referring unresolved trade problems to the WTO. But such transfers of responsibility weaken G8 accountability.
Beyond this, the G8 has acknowledged for some time its responsibility to extend the benefits of globalization to marginalized groups, and to remedy economic and other inequalities. But G8 action has been uneven; some benefits have accrued to disadvantaged populations, but many G8 promises remain unfulfilled.
In spite of their own weak accountability, the G8 leaders expect accountability from other actors. For example, the 1995 Halifax summit called for "a more transparent and accountable [UN] Secretariat".
Civil Society Engagement with the G8
In this paper, “civil society” denotes not-for-profit nongovernmental organizations (NGOs), coalitions and mass movements. Some include business fora as well but this is problematic because the interests, modus operandi and influence of the private sector diverge from those of nonprofit civil society organizations (CSOs). G8 officials themselves distinguish between business players on the one hand and non-profit CSOs on the other.
Four distinct phases can be identified in the evolution of civil society-G8 relations:
Many kinds of NGOs and other civil society groups have engaged with the G8: environmental groups, human rights NGOs, development and relief agencies, mass campaigns, faith-based groups across Christian, Jewish, Muslim, Buddhist, Hindu and other traditions, groups focusing on various social and political issues, youth groups, CSOs focusing specifically on the G8, women's groups, trade unions, professional bodies, research groups and think tanks. The role of celebrities is notable; Bono and Bob Geldof are the best-known examples. As well, other prominent personalities such as Gro Harlem Brundtland and Stephen Lewis have spoken out about the G8.
CSOs tend to concentrate their activities in the summit host country. This has important implications; NGOs from other continents and other countries, particularly from the global south, often lack sufficient financial and human resources to travel to the summit venues. Civil society from the south is often represented by diaspora groups residing in the summit country.
Four modes of civil society interaction with the G8
One important example is the Global Fund to Fight AIDS, Tuberculosis and Malaria.
Civil society has helped raise government awareness of citizen concerns with issues on the G8 agenda and has occasionally stimulated government responses. And CSOs, when engaging in dialogue with official circles, have gained greater appreciation of what is and is not possible for governments to do in the G8 context. Civil society groups benefit from the availability of channels for advocacy vis-à-vis G8 governments. So both parties may be using each other while also benefiting from the interaction.
Four Dimensions of G8 Accountability
Transparency
G8 proceedings have become more open over time. The volume of publicly released documentation has grown significantly from the rather meager output of early summits. There has also been a general trend to disclose more substantial information, including detailed action plans. Media briefings by G8 officials before and during summits are another indication of increased transparency, marking a break from the relative secrecy of earlier years. CSOs have pressed the G8 on transparency for a number of years, but moves toward greater openness are difficult to attribute specifically to civil society activities.
The G8 has much more to do before reaching an adequate level of transparency. The detailed proceedings of the in camera meetings of the leaders remain confidential apart from strategic partial disclosures in off-the-record briefings. But not every G8 government briefs the public with equal diligence. The official archives of the member governments that hold the detailed information normally only become publicly available twenty-five or thirty years after the event, so that documentation of even the earliest G7 summits is only now coming to light.
Consultation
Civil society dialogue with officials of G8 governments is an important means of exchanging ideas and (occasionally) developing shared positions. Dialogue implies willingness to co-operate – not necessarily agree – with G8 governments.
Consultation became part of the regular G8 process with the 2000 Okinawa summit, when the Japanese host government met with civil society leaders from Europe ahead of the meeting, and at the summit itself the Japanese Prime Minister met with representatives of five NGOs to discuss the effects of globalization, the environment, infectious diseases, and the importance of partnership between governments and civil society.
Every subsequent G8 summit, with one exception, has included direct consultation between summit officials and CSOs; the US host government of the 2004 Sea Island summit was unwilling to engage with civil society.
A positive example was the 2006 Civil G8 coalition which organized a year-long series of workshops, meetings including two large NGO fora (one with the participation of President Putin), and sessions with all G8 sherpas.
The push by civil society actors for consultation has strengthened G8 accountability. G8 leaders and other officials are now well socialized into an established process of interchange with citizen groups. The leaders, particularly during their summit hosting year, have come to be expected to consult with civil society. Many CSOs have found consultation to be the most efficacious way of bringing their concerns and proposals directly to the G8.
G8 Performance Evaluation
Evaluative reports assess the G8's compliance with its commitments, acknowledge any advances made and point up failures to fulfil promises. Some evaluations measure performance in terms of a numerical score or a letter grade, while others present a narrative analysis. Assessments from civil society can be used to press the G8 to improve its performance and accountability to the broader global community. These assessments have had an effect; G8 governments now expect this kind of scrutiny, and the G8 itself has recently begun to undertake some self-monitoring.
Seeking Redress
Multi-stakeholder partnerships are potentially the most promising way of obtaining from the G8 redress or remedy for wrong actions or lack of beneficial actions. Examples of situations calling for redress are unfavourable trade conditions imposed on developing countries, and inadequate or misdirected official development assistance.
The various civil society tactics discussed earlier can serve the purpose of seeking redress. Street demonstrations are perhaps the most familiar to the public; the “Make Poverty History” march in Edinburgh in 2005 which attracted 250,000 participants is an important example.
Another tactic has involved petitions, such as the one assembled by Jubilee 2000 in 1998, when it collected signatures to urge the Birmingham summit to forgive all external debt of the poorest countries by the year 2000. The summit responded to Jubilee's petition in a collective statement, implying some acknowledgement of G8 accountability on debt matters.
Media campaigns are another tactic. Press releases and opinion pieces help bring civil society positions to public and government attention, and call for redress. Sympathetic media coverage of civil society concerns can serve to promote G8 accountability, but journalists often focus on the occasional incidents of violence or on “street theatre” rather than on important issues and peaceful action.
Alternative summits, too, have the potential to demand redress from the G8. But all in all, civil society has had limited effect on obtaining redress.
Factors Helping and Hindering Civil Society Engagement with the G8
What strategies and tactics have helped or hindered civil society's efforts to increase G8 accountability?
1. NGOs and civil society coalitions stand a much better chance to have an impact on the G8 when networking with like-minded groups. For example, the Global Campaign against Poverty has brought together a wide array of CSOs and movements concerned with all causes and aspects of poverty.
2. Civil society has been most effective when it recognized and exploited linkages between G8 issues. One positive example is the DATA group (Debt AIDS Trade Africa) which has highlighted the interconnectedness of these issues.
3. More successful CSOs have shown their readiness to be reactive or proactive, according to need. This implies, for example, taking advantage of issues on the G8 agenda that are also important to civil society, as well as lobbying to try to get other civil society concerns on the G8 agenda.
4. CSOs have been more successful in their relationship with the G8 when they recognized the G8 summit as being part of a continuum of major international meetings taking place in any given year. This has implications for continuing action around these other international fora: the UN, the WTO, the IEA, the WHO (World Health Organization) and other organizations.
5. Thorough knowledge of the G8 system and process is crucial for NGOs if they wish to have real impact on G8 accountability. This includes dialogue with the whole G8 system, including ministerial, task force and sherpa meetings, awareness of the timing and agenda of such meetings, and familiarity with G8 member governments' priorities and summit-supporting institutions.
6. Because G8 agenda-building is at least a year-long process, formulated and honed gradually from one summit to the next. CSOs can influence the G8 more successfully if they get involved in the process early.
7. It is a continual challenge for civil society to isolate potentially violent or disruptive elements. After 9/11, this has become even more crucial, and it calls for vigilance, self-patrolling and other efforts at G8 summits.
8. Certain CSOs choose not to engage with the G8, on grounds of resources or ideology. CSOs face difficult choices. Is it worth expending time and energy on dialogue and other interaction with G8 governments around summits and ministerial meetings? Is it worth giving up any influence on the G8 because the latter is perceived as illegitimate or not truly powerful?
9. When a host country is unwilling to interact with civil society, NGOs and other CSOs have other options to influence the G8: advocacy, policy papers, dialogue with receptive non-host G8 governments, and staging parallel events. National NGOs based in G8 countries are in a strong position to lobby their own government.
10. Finally, while G8 government initiatives toward civil society actors are important, civil society does not need to take its cues from government. CSOs have been more influential when they developed strategies on their own terms, rather than depending on G8 “outreach”.
Conclusion
G8 leaders can be held accountable for actions and inactions across a broad range of economic, political, environmental and other global issues. The leaders are individually accountable to their electorates as well as and to their fellow G8 leaders. The G8, as a powerful transgovernmental forum, is collectively accountable to the broader global community including marginalized groups, and to the various regional and global organizations with which they interact. Internal accountability is relatively strong within the broader G8 system, but weaker in democratic accountability to other actors.
In terms of performance on accountability, transparency of the G8 has increased over the years but remains inadequate. Civil society's influence on this is difficult to ascertain except for summit documents and briefings that explicitly recognize CSOs. Public consultation has become common practice and has increased G8 accountability, but the practice remains uneven across the G8. Monitoring and evaluation, including such efforts by civil society, have taken root but they need to become more systematic. Opportunities for obtaining redress for wrong actions or lack of beneficial actions are largely lacking; the few instances of successful multi-stakeholder partnerships have regularized consultations and are working for redress.
Overall, then, G8 accountability is generally still weak. Although civil society has had a major role in enhancing the various dimensions of accountability, this has not yet reached its potential.
Notes and References
1. Putnam, Robert D. and Bayne, Nicholas (1987). Hanging Together: Cooperation and Conflict in the Seven-Power Summits rev. ed. Cambridge, MA: Harvard University Press): 25-27.
2. Kirton, John J. (2006). A Summit of Significant Success: The G8 at St. Petersburg G8 Research Group Toronto 19 July, <www.g8.utoronto.ca/evaluations/2006stpetersburg/kirton_perf_060719.pdf >: 6)
3. Two exceptions are recent contributions by Ullrich on G8 accountability in respect of trade governance and by O'Manique in respect of global health and human rights. Ullrich, Heidi K. (2007). “Toward Accountability? The G8, the World Trade Organization and Global Governance”, in M. Fratianni, P. Savona and J.J. Kirton (eds), Corporate, Public and Global Governance: The G8 Contribution. Aldershot: Ashgate, pp. 99-125; O'Manique, Colleen (2007). “Global Health and Universal Human Rights”, in A.F. Cooper, J.J. Kirton and T. Schrecker (eds), Governing Global Health: Challenge, Response, Innovation. Aldershot: Ashgate, pp. 207-26.
4. Hajnal, Peter I. (2007). Summitry from G8 to L20: A Review of Reform Initiatives. CIGI Working Paper 20.
www.cigionline.org/community.igloo?r0=community&r0_script=/scripts/folder/view.script&r0_pathinfo=%2F%7B7caf3d23-023d-494b-865b-84d143de9968%7D%2FPublications%2Fworkingp%2Fsummitry&r0_output=xml&s=cc
Suzanne Hidi
A. Historical Background
Starting in the late 19th century, scientists Ebbinhaus and James came to realize the importance of interest in humans' cognitive performance. They acknowledged that interest strongly influences what people pay attention to and remember. In the first part of the 20th century the role of interest in improving comprehension, stimulating effort and personal improvement, as well as facilitating learning was recognized by individuals like Dewey (1913), Arnold (1906), Claparde (1905) and others. Berlyn (1949) may have been the first to point out that feelings are an important aspect of interest.
As many of my colleagues and I argued in the second half of the 20th century the significance of affective and motivational variables in general, and of interest in particular, declined, first due to behaviourism and subsequently to the so-called cognitive revolution. However, in the last 25 years, both psychologists and neuro-scientists started to focus again on affective variables, emotions and feelings. Interest was again acknowledged to be a critical motivational variable that influences learning and achievement.
B. Revival of Interest Research
In the latter part of the 20th century, Hans Schiefele, a German educational psychologist, was perhaps the first to argue that interest has a pivotal role in education. Specifically, he maintained that the differentiation, development and stabilization of academically relevant interests should be one of the most important goals of education.
C. Research Findings
Since the revival of interest as an academically relevant concept, a set of wide-ranging empirical studies showed the positive influences of interest on attentional processes, quantity and quality of learning, and the choice and organization of learning strategies, goals and persistence. These findings have been published in a wide variety of papers, journals and books. However, in order to be able to interpret the empirical findings there is a need to discuss on a more theoretical level the conceptualization of interest.
D. Definitions of Interest
What is the most appropriate definition of interest? A momentary fixation? Attraction? Or a fascination? A preference or an attitude? A love of learning or a passion? Traits such as curiosity or motivational belief? Whereas all these conceptualizations have been suggested by various researchers, my colleagues and I consider interest to be a unique motivational variable, as well as a psychological state occurring during interactions between individuals and their environment, characterized by increased attention, concentration and affect. In addition, the term interest can also refer to relatively enduring predispositions to re-engage with particular contents such as objects, events and ideas. Such predispositions develop from experiencing the psychological state of interest over time.
E. Unique Characteristics of Interest
Why do we consider interest to be a unique motivational variable? In contrast to cognitively driven motivational variables such achievement goals, self-efficiency, task-value and self-determination that are viewed as having affect as a cognitive outcome, interest theory conceptualizes interest as having both affective and cognitive components. Conceptualizing affect as an inherent component of interest is one aspect that sets interest apart from the other motivational variables that tend to consider affect as outcome of the representational aspects of motivation and cognitive processing. It also allows the integration of psychological and neuro-scientific approaches. The other aspect that sets interest apart from other motivational variable is that interest has unique biological roots. Specifically, as the neuroscientist Panksepp's work demonstrates, the uniqueness of interest as a motivational variable is related to an evolutionary and genetically ingrained emotional brain system called the seeking system.
F. Interest Types
Two types of interest – situational and individual – have been the focus of research. To demonstrate the triggering of situational interest, think of listening to a lecture on an unfamiliar topic that you unexpectedly find fascinating. This experience is what we call situational interest. In this psychological state, one usually experiences positive affect and focused attention. Once situational interest is triggered, it may not last. Alternatively, it may be maintained. Activities such as asking questions or reading more about the topic can contribute to continuing situational interest.
Reading this article, those of you who previously considered motivational issues in education, may experience what we call individual interest. This type of interest develops over time and is a relatively enduring predisposition to attend to and to reengage with objects, events, and ideas. Individual interest is also associated with positive feelings, increased value and knowledge, energizing and motivating learners' thoughts and actions in goal-directed ways. It is important to understand that both situational interest and individual interest can be associated with the psychological state of interest.
G. The Four Phase Model of Interest Development
Building on and extending existing research, I and others presented a four-phase model of interest development. The proposed model (a) provides a description of how interest unfolds, (b) points to the need for researchers to identify the type of interest they are investigating, and (c) suggests ways in which educators and parents could contribute to interest development. Briefly, the four phases are triggered situational interest, maintained situational interest, emerging (or less-developed) individual interest, and well developed individual interest. My colleague and I summarized the model as follows:
"Each phase of interest can be characterized by varying amounts of affect, knowledge, and value. The length and character of a given phase is likely to be influenced by individual experience, temperament, and genetic predisposition. The four phases are considered to be sequential and distinct, and represent a form of cumulative, progressive development in cases where interest is supported and sustained either through the efforts of others or because of challenges or opportunity that a person sees in a task. However, without support from others, any phase of interest development can become dormant, regress to as previous phase, or disappear altogether."
Self-regulation is presumed to increase with individual interest development.
Introduction
a) Definition
Self-regulation refers to the ways in which individuals regulate their thoughts and actions. Self-regulation of learning refers specifically to those self-generated operations that focus on individuals' acquisition of academically relevant knowledge and skills. Whereas earlier self-regulation research focused on individuals' ability to be active participants of their own cognitive, motivational, and behavioral processes, more recently the capacity to regulate affect has been included as a critical aspect of self-regulation.
b) Zimmerman's Model of Cyclic Phase of Self-Regulation
Zimmerman postulated that self-regulatory processes and associated self-motivational beliefs influence learning in three successive cyclic phases of forethought, performance, and self-reflection, and each phase can be characterized by various sub-processes of self-regulation. Self-motivational beliefs, one of the two major categories of the forethought phase, include interest. Self-efficacy, outcome expectations, and goal orientation are the other motivational constructs that are referred to as self-motivational beliefs. The researchers acknowledged that interest influences the forethought phase.
c) The four developmental levels of self-regulation
Notably, the development of self-regulatory skills has been postulated to have four stages. These are observing a model, emulating the performance, exercising self-control by planning and monitoring ones own performance, and finally self-regulating and adopting to changing internal and external conditions.
Interest and Self-Regulation: Reciprocal Interdependence
Although interest and self-regulation tended to be investigated independently, these two variables are closely associated and reciprocally interdependent. Similar positive outcomes have been associated with interest and self-regulation, such as increased attention, superior selection of goals and learning strategies and higher levels of learning.
Furthermore, as empirically demonstrated, they are both linked to perceptions of self-efficacy. Even though self-regulation can be taught and may occur without high levels of interest, the development and maintenance of self-regulatory skills can be greatly enhanced by learners' interest in relevant activities. Furthermore, interest development in activities may contribute to the development of self-regulatory skills by resulting in less conscious goal-direction, triggering more automatic processes and leading to greater overall effort.
Self-regulation researchers like Zimmerman and Pintrich acknowledged that interest contributes to the learning of self-regulatory processes and to the maintenance of such acquired skills, although they tended to focus on goals as the most relevant motivators of self-regulation. That is, they argued that how much learners valued and expected to attain goals and mentally represent them is the critical influence on individuals' motivation to self-regulate. Whereas these researchers acknowledged the importance of interest in the forethought phases of self-regulation, they did not recognize the importance of interest in the performance stage. That is, the psychological state of interest during an activity with concurrent physiological changes – such a positive feeling, and increased dopamine levels – may contribute the development of self-regulation. Interest researchers go as far as arguing that interest development can occur before having cognitively represented goals and can play a unique role specifically in the development of self-regulation, as well as in all forms of knowledge acquisition and performance.
Cancer"Screening for Cancer: Are We chasing an Elusive Dream?
Anthony B. MillerIt seems self-evident that early detection of breast cancer will reduce deaths from the disease. There are two forms of early detection. The first is accomplished by breast cancer awareness, education about the risk of cancer and the promotion of breast self examination. These measures resulted in a tendency for tumours to be diagnosed at a less advanced stage, and the introduction of lumpectomy instead of mastectomy for many cancers found in this way. The second component of early detection is screening, the administration of a test to find disease before symptoms have developed. But screening has many components, and has not proved entirely effective, as I shall show.
What do we expect from screening? Principally, reassurance that we do not have cancer. However, if we do have cancer, we hope that early detection of the cancer yields the possibility for curing it.
Conversely, what do we NOT expect from screening? Certainly we do not expect to be told that we do not have cancer when we do. Yet, it must be understood that no one can promise absolute certainty from a screening test. All tests will miss some cancers that are in fact present at the time of the test. But also, we do not expect detection of a “cancer” that will never cause us any harm. Yet this is what nearly all screening tests do, a process we call over-diagnosis.
In this talk I plan to describe some of the deceptions that have unwittingly been practiced on a gullible public, not because there is any “plot” to deceive people, but because very often, those advocating screening have an imperfect understanding of its many deficiencies.
To take the example of breast cancer. Since about 1990, there has been a remarkable drop in mortality from breast cancer (the death rate from breast cancer in the population) in many countries, especially the UK, the USA and Canada (Figure1). Most commentators have attributed this success to mammography screening, though a few also credit improvements in therapy. In fact the time relationships of the fall with the introduction of screening by mammography in Canada make no sense at all. Few screening programs had been introduced by 1990, and many did not affect a high proportion of the population before 1996. And the scientific trials that showed screening was effective also showed that there is a 5-7 year delay after starting screening before a reduction in breast cancer deaths is seen. The alternative explanation for the mortality drop is improvements in therapy, especially the introduction of adjuvant hormone therapy (tamoxifen) in post-menopausal women, and adjuvant chemotherapy, in pre-menopausal women. As these therapies were introduced in the mid-1980s, a reduction in mortality starting around 1990 is entirely compatible with improved treatment.
Figure 1: Trends in Mortality from Breast Cancer in Canada: age-standardized rates per 100,000 women
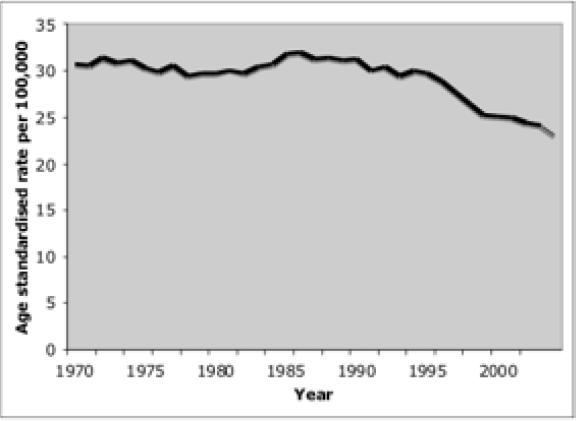
We must remember that screening only works if an effective treatment for the cancer discovered by the screening test is available. This probably explains the fact that until 1990, after the introduction of the new treatments in the 1980s, there had been no reduction in breast cancer mortality, in spite of the earlier detection occurring during the previous two or more decades. But if we become able to cure all cancers with treatment, there will be no role for screening. So as treatment improves, the role of screening becomes less important.
Why do people credit screening with the recent fall? One of the reasons is that an expert group assembled by the International Agency for Research on Cancer in 2002 concluded that for women aged 40–49, mammography screening reduced risk of death from breast cancer by 12%, and for women aged 50–69 the reduction was 25% (IARC, 2002). These figures seem impressive, even though they are less so for younger women. But they are far less impressive when you relate them to the actual risk of death at different ages as in the following table:
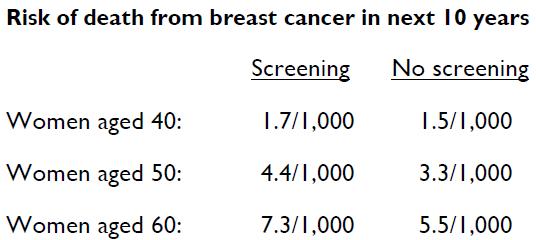
Yet women invited to be screened are never told that the benefit for them may be vanishingly small.
In Canada, the National Breast Screening Study (CNBSS)-2 directly evaluated the role of mammography screening in women age 50-59, over and above any benefit derived from careful physical examination of the breasts; the latter was performed in all provinces except Quebec by trained nurses. In Quebec, doctors performed the examinations. 39,405 volunteers were randomized after informed consent to either the MP arm: annual two-view mammography + physical breast examination + breast self-examination (BSE); or to the PO arm: annual physical breast examination only + BSE. Four or five annual screens were conducted, and currently 16 years of follow-up are available. Of the invasive breast cancers detected by screening in the MP arm, 126 were detected by mammography alone with an additional 141 detected by mammography plus physical examination or by physical examination alone. In the PO arm 148 were detected by the physical examinations. Of the non-invasive in situ cancers, 73 were detected in the MP arm, the large majority by mammography, compared to only 16 in the PO arm. In spite of this excess of cancers found by mammography, there has been no impact on breast cancer mortality during follow-up (Miller et al, 2000).
These negative findings were greeted by the radiology community with accusations that the mammograms were poor – however this ignored the near doubling of cancer detection rates achieved by mammography, and the fact that cancer detection was if anything superior to the rates achieved in other screening programs. Recently, in collaboration with Erasmus University, Rotterdam, a validated simulation model was applied to our data, and this indicated that mammography resulted in a 16-36% reduction in breast cancer mortality and the physical examinations resulted in a 20% reduction in breast cancer mortality in comparison to no screening (Rijnsburger et al, 2004).
One outcome of the Canadian trial was to provide a scientific basis for an alternative approach to breast screening that is currently being evaluated in a number of low and middle income developing countries, following a pilot study that commenced in 2000 in Cairo (Boulos et al, 2005). There are already preliminary indications from this study that a shift towards a more favourable stage distribution (earlier stage at diagnosis) is being achieved (Miller, 2008). Through the Eastern Mediterranean Region of the World Health Organization similar studies have been initiated in Sana'a, the Yemen, Khartoum, Sudan, Erbil, Iraq and Yazd, Iran. Each program is modifying the project to its own culture and facilities.
I turn now to consider screening for Prostate Cancer, increasingly a topic for public discussion, especially now the Ontario government has decided to pay for PSA blood tests. There has been a major increase in incidence of prostate cancer in Canada, largely because of the PSA test, but there has been little impact on prostate cancer mortality (Figure 2).
Figure 2: Trends in Incidence and Mortality from Prostate Cancer in Canada: age-standardized rates per 100,000 males.
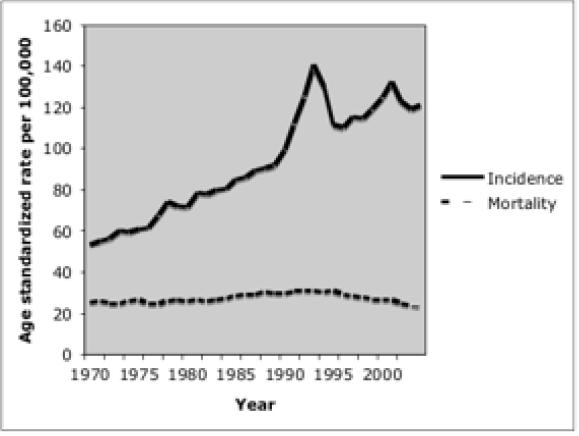
There are two prostate screening research trials ongoing and both began in 1993. The US trial recruited 76,705 men, screening has finished and follow-up for some participants exceeds 13 years. The European trial is larger (~200,000). Neither trial has been stopped, nor have any mortality results been reported, which they would have been if a significant benefit had been seen. So we can conclude there is no early benefit from screening for prostate cancer.
Yet data are accruing from these trials that give us more understanding of the potential adverse effects of screening. Estimates from the Rotterdam component of the European trial show that lead time (the time by which diagnosis of prostate cancer is advanced by PSA testing compared to when diagnosis would have occurred in the absence of screening), is on average 11.2 years, while over-diagnosis occurs in 48% of the cancers detected, i.e. these cancers would never have presented in the subjects' lifetime in the absence of screening (Draisma et al, 2003).
The implications of long lead times and over-diagnosis are serious for a man age 65, if the use of PSA results in detection of a prostate cancer. There is nearly a 1 in 2 chance that the detection of the cancer was unnecessary. The man will live all his remaining years with the knowledge of a cancer diagnosis. Yet there is no evidence of benefit, so it is very likely that the impotence and incontinence resulting from his surgery are unnecessary.
In a recent book, Raffle and Gray (2007), both concerned with the national screening programs in the UK, have coined the term the “Popularity Paradox” to cover this situation, “The greater the harm through over-diagnosis and over-treatment from screening, the more people there are who believe they owe their health, or even their life, to the programme.”
Screening for cancer does seem to work if cancer precursors can be detected and treated. The best example is the Pap smear for cancer of the cervix, introduced for screening first in British Columbia in 1949. In practice, for about two decades, mortality from the disease has been falling in most countries, with reductions since 1950 of about 80% in countries with the most successful programs, including Canada and the USA (Figure 3).
Figure 3: Trends in mortality from Cancer of the Cervix: age-standardized rates per 100,000
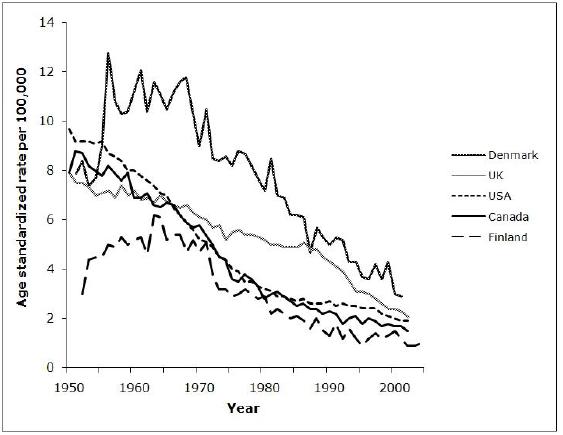
However, the reduction achieved has been as great in Finland as in Canada and the USA, even though in Finland screening is offered only every 5 years, and only to women age 30-59, while in the USA and Canada screening tends to start soon after onset of sexual activity, and is often done annually. Thus in terms of mortality reduction, although the US and Canada have done as well, this success has been at the cost of far greater resources expended, largely because the lessons we have learnt about the natural history of the disease have not been applied.
We learnt many years ago from studies in British Columbia and Toronto that the majority of precursor lesions of the cervix regress without treatment, especially at younger ages. Yet many gynecologists still tend to advocate screening every year, thus over-treating many women with vast expenditures in resources. Although vaccination for the primary cause of cervix cancer, the Human Papillomavirus (HPV), is being introduced for adolescent girls age 13-19, the vaccine is only capable of preventing about 70% of the cases, thus perpetuating the need for screening for many decades until vaccines become available that can immunize against all the oncogenic HPV types.
New screening programs for colorectal cancer are now planned, most in Canada using tests for fecal blood. The trials which established the efficacy of these tests showed mortality reduction ranging from 13% to 33%. Achieving even these levels of success will require substantial proportions of the population at risk to comply with screening. This may not be easy to do. However, there is already an indication that the potential benefits of the program are being oversold.
Recent Ontario Government publicity states:
“When caught early through regular screening, there is a 90 per cent chance colorectal cancer can be cured” (http://ogov.newswire.ca/ontario/GPOE/2008/03/14/c4114.html?lmatch=&lang=_e.html; March 14, 2008)
This is a major piece of misinformation. A mortality reduction of 13 to 33% does not translate into a 90% cure rate.
To conclude: Screening is an expensive use of health care resources, especially if non-progressive abnormalities are detected and treated. Screening can not abolish mortality from cancer, and people who accept screening should not be deceived that it will.
We should be putting more resources into preventing cancer.
References
Boulos S, Gadallah M, Neguib S, Essam Ea, Youssef A, Costa A, Mittra I, Miller AB. Breast screening in the emerging world: High prevalence of breast cancer in Cairo. The Breast 2005; 14:340-346.
Draisma G, Boer R, Otto SJ, van der Cruijsen IW et al. Lead times and over-detection due to prostate-specific antigen screening: Estimates from the European Randomised study of Screening for Prostate Cancer. J Natl Cancer Inst 2003; 95:868-878.
IARC Handbooks on Cancer Prevention, Vol 7, Breast cancer screening. Lyon, IARC Press, 2002.
Miller A. Practical applications for clinical breast examination (CBE) and breast self-examination (BSE) in screening and early detection of breast cancer. Breast Care 2008; 3: 17-20.
Miller AB, To T, Baines CJ, Wall C. Canadian National Breast Screening Study-2: 13-year results of a randomized trial in women age 50-59 years. J Natl Cancer Inst 2000; 92:1490-1499.
Raffle A, Gray M. Screening. Evidence and Practice. Oxford. Oxford University Press, 2007.
Rijnsburger AI, van Oortmarssen GJ, Boer R, Draisma G, To T, Miller AB, de Koning HJ. Mammography benefit in the Canadian National Breast Screening Study-2: a model evaluation. Int J Cancer 2004; 110: 756-762.
Planet Earth's Deeper Water CyclesPierre-Yves Robin
Water cycles
We are familiar with Earth's 'atmospheric' water cycles, which result from the combined effects of solar energy and gravity on water and its vapour. Heat from the Sun evaporates water from oceans, lakes, rivers, puddles, morning dew, etc. Water vapour, less dense than nitrogen and oxygen, rises through the troposphere*. But temperature decreases with elevation in the troposphere, and rising water vapour eventually condenses. Clouds are the turbulent sites of the fight between solar heat and gravity, between evaporation and condensation: water vapour rises but then condenses, and water droplets sink but then re-evaporate. Eventually, however, rain has to match evaporation from Earth's surface.
The residence time of water in the atmosphere is less than 10 days. In oceans (ca. 97.2% of surficial H2O), it is approximately 4,000 years and in ice sheets (ca. 2.15%
of surficial H2O) it is 1,000 to 10,000 years. The remaining 0.65% of surficial H2O is mostly (0.62%) groundwater; and only 0.03% is in lakes and rivers. Residence time in large lakes is less than ten years and in rivers less than two weeks. Residence time as groundwater is mostly a function of the depth water reaches and ranges from a few hours or a few days in soil, from which water evaporates quickly after the rain or is pumped out by plant roots, to centuries or even millennia† where water descends to depths of several kilometres. 'Cycles', in the plural, is used in this essay because of this large range of residence times, from hours to millennia. Being limited to the top few kilometres of Earth's crust as well as the atmosphere, we may call them 'shallow water cycles’.
This contribution discusses longer and deeper water cycles, with durations of millions to tens of millions of years and depths of tens to hundreds of kilometres. One such cycle, called here the 'short' mantle water cycle, has been known and understood by geologists, at least quantitatively, for over 35 years. The author's contribution to the field is the proposal of another cycle, which might be called a ‘long’ mantle water cycle.
The hot plume that rises from the volcano on the Caribbean island of Montserrat (Figure 1) illustrates the

Figure 1. The Soufriere Hills Volcano, on the island of Montserrat (ca. 17 km in its longest diameter), Lesser Antilles, has been in intermittent eruption since July 1995. This image (NASA/Jet Propulsion Laboratory, 29 October 2002) illustrates two water cycles. (1) The puffs of cloud carried toward the south-west by trade winds contain water mostly evaporated from the Atlantic Ocean. (2) The hot ‘plume’ rising from the volcano mainly consists of water droplets in water vapour and some CO2. That water was originally captured from the ocean by mud formed on the ocean floor, and that mud was pulled into Earth’s mantle some eight million years ago.
existence of water cycles deeper than the shallow water cycles discussed above. While magma – the rising molten rock – can capture water from groundwater surrounding the underlying magma chamber and from groundwater within the volcanic edifice, the chemical composition of the water in the Montserrat lava showed that it mostly came from a deeper part of the Earth which we call the mantle*.
To explain these deeper cycles, we must first review „how Earth works', or, more specifically, describe Plate Tectonics. We must also explain more precisely what is meant by 'water' and the various forms that our familiar component H2O can take.
Plate Tectonics
In 1965, Professor John Tuzo Wilson (1), at the U. of Toronto, coined the term 'plate' and provided the first complete description of what came to be called „Plate Tectonics'. The model revolutionized geology. In essence, Earth's surface consists of approximately 15 tectonic plates that move with respect to each other (Figure 2). Contact boundaries between adjacent plates are of three end-member types (Figure 3).
Figure 2
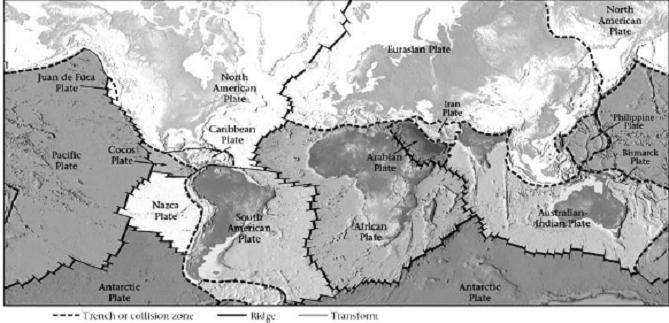
Figure 2. Earth’s surface behaves as 15 relatively rigid plates that move with respect to each other. New oceanic crust is created along ridges such as the Mid-Atlantic Ridge. Along collision zones, such as that of the Lesser Antilles, one of the plates, such as the North American Plate, is subducted into the mantle under the other, here the Caribbean Plate. Along transform fault boundaries, such as the northern border of the Caribbean Plate, parallel to the Greater Antilles (Cuba and Jamaica, Haiti and the Dominican Republic, Puerto Rico), two plates slide horizontally past each other. (Image by W.W. Norton & Cy.)
Plate tectonics is an example of thermal convection, like that in a pan of soup on a stove top, driven by the heat stored and generated inside the Earth. Its special features are due to the mechanical stiffness of the 'plates', which is the reason for their name. This stiffness is essentially a consequence of the relatively low temperatures (from atmospheric temperature to 1100ºC) that prevail in the top 100 km of the Earth, at least away from trenches or ridges. That hard top layer is called the lithosphere, the 'stony sphere', which thus includes the crust and the upper, cooler part of the mantle. When the lithosphere descends into the mantle at a subduction zone, it is commonly called a slab, a reference to its continuing relative rigidity. Below the lithosphere is the asthenosphere, the 'sphere without strength'. These terms are very misleading: they suggest a) that the asthenosphere is not made up of rock and b) that it is weak. In fact, except in very rare – and shallow – locations discussed below, the asthenosphere does consist of rock, and, compared to any magma, it is very stiff*.
Still, some melting does proceed in Earth's mantle, which is why volcanoes erupt. Two mechanism are responsible: decompression melting and hydration melting. Decompression melting occurs where rocks of the asthenospheric mantle rise 'rapidly' (ca. 1 cm/year!) so that the pressure on them is decreased while their temperature is still in excess of 1250º to 1300ºC. High pressure normally inhibits melting, but, at sites where mantle rock rises, decompression elicits partial melting at depths of 60 to 120 km. That melt is less dense than the rock from which it forms, and it rises past its host toward the surface. Decompression melting occurs at divergent boundaries where, we recall, mantle rises to fill the gap between the diverging plates (Figure 3).
Volcanism along mid-oceanic ridges is mostly submarine except in rare places like Iceland. Decompression melting also occurs above mantle plumes (Figure 3).
The best known examples of volcanoes above mantle plumes are those of Hawaii (Pacific Ocean) and of Réunion Island (western Indian Ocean) It is thought that some small melt fraction may start to form at a depth of ca. 130 km, but that the bulk of the melt that reaches the surface forms at depths between 80 and 120 km.
One fundamental observation that is readily explained by Plate Tectonics is that Earth's crust is sharply divided into two types: continental crust and oceanic crust (Figure 3). The elevation of the top surface of continental crust ranges from 8,859 m (top of Mount Everest) to ca. 150 m below sea level (continental shelves). In contrast, two thirds of Earth's crust is oceanic: its top surface generally lies at a depth greater than 200 m below sea level, and much of it greater than 2 km.
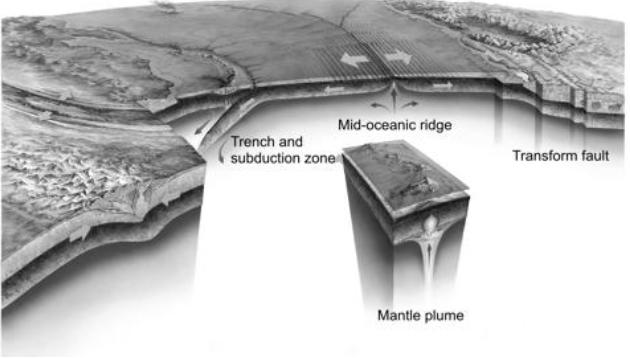
Figure 3. Decompression melting of the rising hot mantle at mid-oceanic ridges creates the igneous base of new oceanic crust. Decompression melting is also responsible for oceanic islands above mantle plumes such as Hawaii. Hydration melting causes volcanism at subduction zones such as the Pacific Ring of Fire or the Lesser Antilles Arc. Note the deep oceanic trench that forms along the line where oceanic lithosphere is subducted. (W.W. Norton & Cy., original artwork by Gary Hincks)
Plate Tectonics explains that the current oceanic crust has been formed in the last 200 million years along ridges. Oceanic crust thus consists of a layer of dense and dark igneous rocks, formed from the solidification of magma produced by decompression melting at mid-oceanic ridges, overlain by a layer of sediments deposited on top of these igneous rocks as they move away from these ridges. These sediments make up a relatively thin layer wherever emerged land is far away. But they can form very thick accumulations in the deep oceanic trenches that form above subducted lithosphere if these trenches are adjacent to emerged – and therefore eroding – land.
Continental crust, in contrast, consists of less dense material – hence its higher elevation – that has been collected and moulded, often many times, over four billion years. Being less dense, continental crust generally resists subduction. Much of its 'collecting' and 'moulding' occurs above subduction zones and magmatism is a fundamental process of its evolution.
Indeed, subduction zones are the other sites on Earth where partial melting of mantle rock occurs (Figure 3). That melting is responsible for what is called arc magmatism, where 'arc' refers to the shape of chains of volcanoes such as the Lesser Antilles, the Aleutian Islands and others. Hydration melting, is responsible for melting there. Addition of water to hot mantle rock is known to decrease the temperature at which it starts to melt. As a plate is subducted along a convergent boundary, water escapes from it and, because of its relative buoyancy, rises up through the overlying mantle until it encounters some rock that is hot enough to partially melt upon receiving that water. This partial melt then rises through the host mantle, and volcanoes above subduction zones are consequences of that phenomenon. These include volcanoes on the Pacific Ring of Fire, as well as those of Indonesia, Italy and the Lesser Antilles, including therefore Soufriere Hills. However, to explain how a subducted lithospheric plate might bring water down with it, and then liberate that water as it descends, we must discuss the various form of H2O on Earth.
There is water, and then there is H2O
When discussing water so far, we have implicitly assumed either liquid water, such as in rivers, oceans and groundwater, water vapour in the atmosphere, and ice. But H2O is also an important constituent of many minerals. The ability of H2O to be incorporated in minerals and to be expelled from the rock only as these minerals become unstable is a fundamental aspect of both 'short' and 'long' mantle water cycles.
As mentioned above, oceanic crust consists of a layer of igneous rocks overlain by a layer of sedimentary rocks. Both kinds of rocks contain liquid water in pores and fractures. But many minerals also contain oxygen and hydrogen in their structures. For example, the chemical composition of a 'clay mineral' called sodium montmorillonite, one of a large group of minerals common in ocean sediments, can be written as:
0.7 Na2O - 1.65 Al2O3 - 0.7 MgO - 8 SiO2 - (2 + n) H2O, where n is typically 3.
Such H2O, which, for n = 3, amounts to 11% by weight of the mineral, is called 'structural water'. It is in a solid state: rather than percolate away, it stays in the rock unless the mineral becomes unstable and breaks down. Minerals such as montmorillonite are described as hydrous minerals. A reaction in which a hydrous mineral breaks down and in which the liberated H2O is only partially taken by other minerals, such as a mica (with only 3.9 weight % H2O), that form as products of this breakdown is a dehydration reaction. There are many hydrous minerals that accumulate on the ocean floor or that form in igneous rocks reacting with sea water, which can thus bring structural H2O into the mantle.
Other minerals, such as mantle minerals wadsleyite and ringwoodite discussed later, are nominally anhydrous minerals. Unlike montmorillonite or micas, they are stable even when they do not contain any H2O. But at the pressure in the mantle both wadsleyite and ringwoodite can dissolve up to 3.5% H2O by weight, that amount decreasing with increasing temperature. Such 'water' dissolved in crystals is also 'H2O in solid form' and it will therefore remain with its host mineral if it is transported around the mantle.
The short and the long water mantle cycles
Subduction zones are, we recall, sites where large volumes of lithospheric rock plunge down into the mantle. As the temperature and pressure on these rocks increase, hydrous minerals formed at the surface break down and are replaced with minerals that contain a lesser fraction of H2O but which resist higher temperatures. Those, in turn, may breakdown at further depth and higher temperature. What happens to the water that is gradually released by these dehydration reactions?
It is thought that water released at depths less than ca. 80 km percolates back to the surface along the top of the slab and the cool 'mantle wedge' above it. Water that is released at depth around 100 km, on the other hand, percolates through a hotter part of the mantle wedge, and, where that mantle is hot enough, that water causes partial hydration melting. Thus, the water that currently comes out of the Soufriere Hills lava (Figure 1) comes from the dehydration of minerals that were in the trench east of the Lesser Antilles ca. eight million years ago. Typically, this short cycle returns H2O to Earth's surface in less than ten million years after subduction.
This 'short' mantle cycle has been recognized since the early 1970s. However, semi-quantitative analyses and experimental work over the last 20 years suggest that this cycle is probably not closed: more H2O may descend into the mantle than rises up through arc magmatism. The first line of argument was based on estimates of H2O that is subducted vs. those of water that rises up with arc magmas. A recent estimate (2) puts the global rate of subduction of pore water and structural H2O at 1.83 billion tons per year worldwide. Thus, on average, every day, along each metre of oceanic trench, some 113 kg of H2O descends into the mantle. Some of it, probably most of the pore water in sediments and loosely bound structural H2O, estimated to 1.2 or 1.3 billion tons per year, is squeezed out of the rock at shallow depth, say less than 40 km, and rises toward the trench and back to the ocean rather than through the hot mantle. It thus does not contribute to melting that mantle. On the other hand, the balance, ca. 0.6 billion tons, is expected to descend down further.
Estimates of H2O expelled by arc magmatism are more uncertain: early estimates were low – ca. 0.1 billion tons per year – thus leaving 0.5 billion tons of H2O per year plunging lower down into the mantle. More recent estimates broaden the range of uncertainty, from 0.09 to 0.6 billion tons. The latter amount matches that of descending H2O and would thus not require that any H2O go further down.
But another line of inquiry does suggest that the short mantle cycle is not closed. Experimental work on stability of hydrous minerals and modelling of the pressure and temperature conditions prevailing along the top, hydrated, surface of the descending slab indicate that a large number of minerals should carry structural H2O to greater depths, of several hundreds of kilometres (3). This, rather than H2O mass balance, has become the main argument for the existence of 'longer mantle cycles'.
Competing models for the fate of deep H2O
What happens to the H2O that descends below the depth at which it can be exhaled by arc magmatism was left vague for several years. But recent ideas focus on minerals that are stable in a range of depth in the mantle that is called the transition zone (Figure 4).
Whereas a large fraction of mantle rock above a depth of ca. 400 km consists of a mineral called olivine, olivine is not stable below that depth: it is replaced by wadsleyite, and further down, by ringwoodite. In turn, ringwoodite ceases to be stable at depths greater than ca. 670 km. Transition zone designates that region of the mantle between 400 km and 670 km, whereas below 670 km, and down to 2,900 km, lies the lower mantle (Figure 4). As mentioned earlier, as hydrous minerals become unstable with increasing depth, wadsleyite and ringwoodite are able to absorb the H2O that is released. In contrast, minerals in the lower mantle, where ringwoodite ceases to be stable, cannot take any significant amount of water in solution.
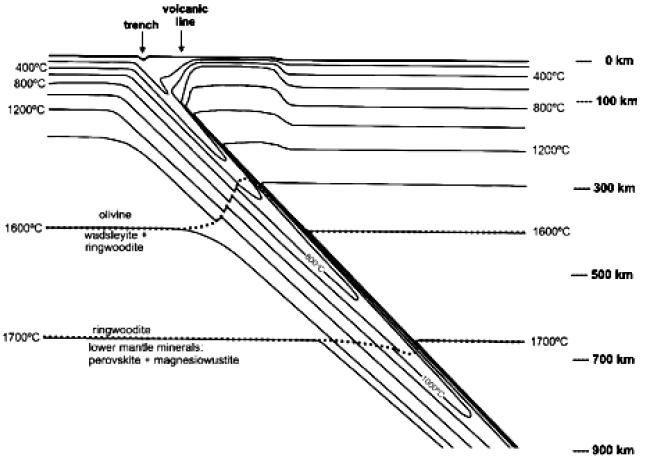
Figure 4. A descending lithospheric slab maintains a cooler temperature than that of the ambient mantle for a long time. The pressure at which olivine reacts to form the transition zone minerals wadsleyite and ringwoodite and that at which ringwoodite reacts to form lower-mantle minerals depend on temperature, and these reactions therefore proceed at different depths in the slab than in the ambient mantle (4).
A recent contribution (5) focuses on the process of diffusion and argues that either H2O should diffuse away from the hydrous rocks at the top of the subducted slab into the ambient mantle or it somehow concentrates as a liquid near the top of the slab.
The present author argues instead (6) that the fate of H2O liberated at the top of a slab is determined by actual percolation of H2O-rich fluids rather than by diffusion of H2O. In deforming material, a free liquid tends to collect in fractures that are parallel to the direction of greatest compression*. In addition, when such fracture is not horizontal, a liquid that is less dense than the surrounding rock tends to rise, which is in fact how and why magma formed at a depth of 100 km in the mantle rises toward the surface.
By performing an analysis of the forces acting on the slab, combining the drag applied by the resisting ambient mantle with the compression along the slab
itself, we have shown that any H2O-rich liquid liberated by dehydration reactions should flow up and end toward the colder interior of the slab (Figure 5). There, H2O will form new hydrous minerals that are stable because of the lower temperature, or, in the transition zone, it will be dissolved into wadsleyite or ringwoodite. One way or the other, H2O will become again 'structural H2O' and will resume its descent with its host rock. Eventually, when the rock reaches the bottom of the transition zone, ringwoodite – by then the main host of H2O – becomes unstable, and an H2O-rich liquid must rise up through the slab, still guided to stay inside the slab by the same fracture directions. That liquid will rise until it meets ringwoodite or wadsleyite that is not already saturated with H2O, at which point H2O is dissolved in the mineral and descends again toward the bottom of the transition zone (Figure 5b). Since H2O keeps being introduced at the trench but cannot go down below 700 km, the H2O content of the slab will gradually increase as a subduction zone becomes older. Therefore the liquid liberated at the bottom of the transition zone has to rise higher and higher before finding a dry ringwoodite to absorb it.
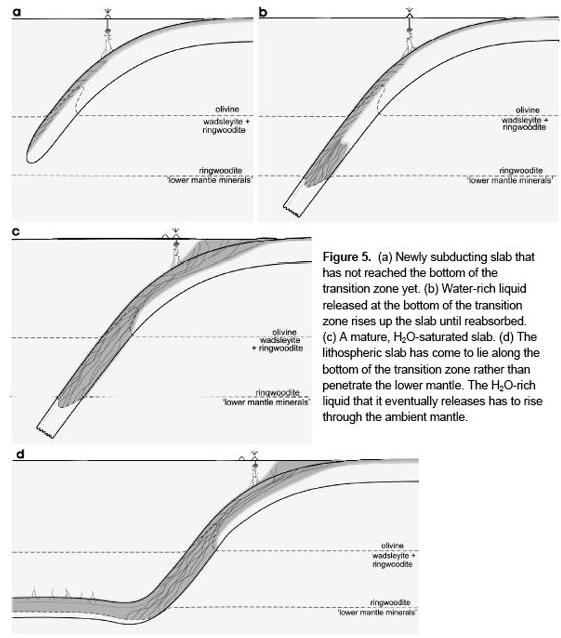
Eventually, the slab becomes entirely saturated with H2O throughout the transition zone and the upper mantle, and water will rise all the way to the trench: the 'long mantle water cycle' is then closed (Figure 5c). If the trench is filled with a thick wedge of sediments, water should percolate through that wedge. In a trench that is relatively free of sediments, far away from any emerged land, the rising water would be responsible for serpentine mud volcanoes, conical accumulations of mud of hydrated mantle minerals and rock fragments formed around water vents that have indeed been observed near deep oceanic trenches.
Yet, this water cycle is not always completely closed. Mantle tomography shows that in many places, the lithospheric slab comes to lie down at the bottom of the transition zone (Figure 5d) instead of penetrating the lower mantle. In that case, the H2O it still contains is no longer guided up the inclined slab. As the rock becomes hotter with time, the solubility of H2O is ringwoodite decreases, and some H2O-rich liquid eventually forms and rises through the transition zone and the upper mantle water. We propose that this phenomenon is responsible for some mantle plumes, that is, for some of the igneous activity that is not directly related to divergent or convergent plate boundaries.
Some consequences
Let us focus here on some geochemical and geophysical consequences of our deep mantle water cycle: compositions of some mantle plume magmas and deep focus earthquakes.
Hydrogen is only one of a number of chemical elements described as 'incompatible'. An incompatible element is one that does not readily enter into the dominant minerals present in the rock. These elements prefer to be in a liquid; when there is no liquid, they are hosted by relatively minor and rare minerals that can accept large concentrations of these elements and which we may call 'incompatible-element minerals' (IEM). Incompatible elements will follow H2O in the cycle described here: when H2O is trapped as structural water, incompatible elements are hosted by their IEMs. And when a reaction releases free liquid, IEMs are dissolved and the elements hitch a ride with the liquid, until the H2O in that liquid is again absorbed and IEMs have to form again. Like H2O, incompatible elements are continuously introduced into the subducted slab at the trench: with age, a slab will therefore become rich in these elements as well as water-saturated. The model thus predicts that the liquid rising out of a flat-lying slab such as in Figure 5d will be rich in incompatible elements. We argue that the unusual chemical compositions of some mantle plume magmas, the best known ones being kimberlite magmas (the main carriers of diamonds to the Earth's surface), is an expected consequence of the model.
Deep-focus earthquakes – with foci deeper than 100 km and down to 690 km – occur in all subduction zones. In the absence of fluid pressure in the rock, the extreme pressure* on the rock should inhibit any faulting and therefore any earthquake. While some geologists have speculated about phenomena other than faulting to explain these earthquakes, the water saturation of a mature slab (Figure 5c, d) readily accounts for the fluid pressure that permits them.
References
1. A new class of faults and their bearing on continental drift. J. Tuzo Wilson, Nature 207 (4995), 343-347, July 1965.
2. Subduction fluxes of water, carbon dioxide, chlorine, and potassium. Richard D. Jarrard, Geochemistry, Geophysics, Geosystems 4(5), 50 pp. May 2003.
3. E.g. Hydrogen in the deep earth, Q. Williams and R.J. Hemley, Annual Reviews of Earth and Planetary Sciences, 29, pp. 365-418, 2001.
4. Geodynamics. Second edition. D.L. Turcotte and G. Schubert, Cambridge University Press, 2008.
5. Slab dehydration in the Earth's mantle transition zone. G. Richard, D. Bercovici and S.-I. Karato. Earth and Planetary Science Letters, 251, pp. 157-167, 2006.
6. Stress trajectories in descending lithospheric slabs and the consequent water cycle. P.-Y.F. Robin and C.M.I. Robin, Subduction Conference, Montpellier, France, June 2007.
On The Years of the Highest High and the Lowest LowJohn W. Senders
"New information usually lies in the outliers of a data set."
Claude Bernard
Introduction
Weather reports on television and radio present, as a rule, not only the high and low temperatures for the day but also the highest high (the max/max), and the lowest low (the min/min) ever recorded for that date. Casual observation over a longish period led me to the feeling that the years in which the max/max occurred were generally and significantly more recent, than the years in which the min/min occurred. I have examined recorded temperatures for the city of Toronto, Ontario for the first 120 days of the year, from 1 January through 30 April, over a span of about 150 years; for the city of Belleville, Ontario for all 365 days over 123 years; and for Eastport, Maine for all 365 days over 116 years (1874 to 1990), and present the results here.
Hypothesis Generation
For any day of the year, January 14 for example, the year of the minimum observed daily low temperature (the min/min) for that date should be equally likely to be later or earlier than the year of the maximum observed daily high temperature (the max/max) for January 14. However that is not what is observed.
On the one hand, if mean temperatures are rising, then the daily minima and maxima should tend to rise together, perhaps in accord with the hypothesized "greenhouse effect," and the years of daily max/max's and min/min's should be equally distributed over past and future years. An alternative or supplemental hypothesis is that a greenhouse effect may be more likely to result in a truncation of the lows rather than an extension of the highs, as a result of inhibition of radiation losses in the night.
Results
My analysis for all the tables is as follows: if I were to examine temperature data for one day in January, say January 14, over 145 years of recorded daily temperatures, I could find the year in which January 14 had the highest of all highs (ie: the max/max) for that date. I could also find a year in which the min/min occurred for that date. If the year of the min/min is more recent than the year of the max/max, it is tabulated in column 2, row 1 of Table 1, contributing 1 to the 4 entered there. According to Toronto data for January over a 145 year period, there were only 4 days in which the min/min was more recent than the max/max. In contrast there were 27 days when the max/max had occurred more recently than any min/min for that day.
Table I summarizes data for Toronto obtained from the Toronto office of Environment Canada. The data were the daily maximum and minimum temperatures of each day for the first four months of the year, from 1 January through 30 April from the inception of the weather office, in 1840, through 1985; and then for each year for 1986 through 1991.
TABLE I - Number of Days of Temperature Extremes by Recency: Toronto, January-April, 1840-1985-1991
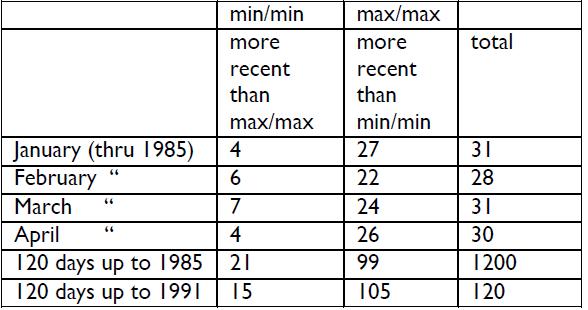
The Z-scores confirm that all these differences are highly significant, as one might imagine from inspection alone. The last line of Table I shows that for the 120 day period, through 1991, 105 days had a more recent max/max and only 15 had a more recent min/min. Over the 120 consecutive days, the evidence is overwhelming that max/max is more recent than min/min. This finding confirms what we expect to be the case: Toronto is getting warmer, at least in the winter. Environment Canada suggested that the data might well be the result of increased heat storage in the continually increasing construction of buildings and roads (i.e., urbanization) Environment Canada suggested that Belleville, Ontario should not be subject to the warming effect of urbanization so that a similar finding might be more confidently interpreted as evidence of a general climatic warming (in the area of Belleville at any rate). Table II summarizes the data for Belleville, Ontario.
TABLE II – Belleville, January through December, 1866-1989
The entries are the number of days in each month.
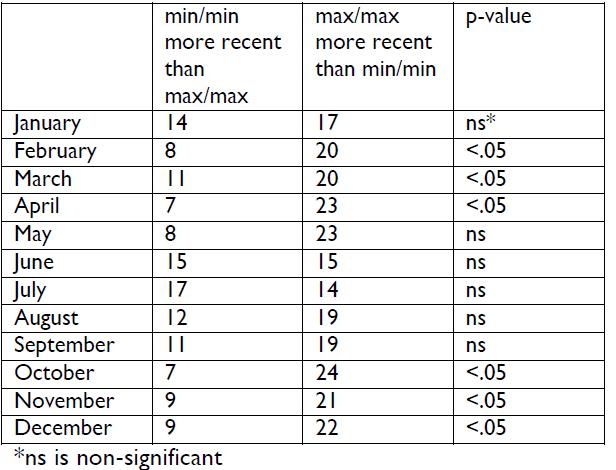
The Belleville data also show a marked asymmetry: the years of max/max for 8 months of the year are significantly more recent than the years of min/min. All other differences were not significant. The data are in accord with the alternative hypothesis that there is a truncation of minima as a consequent of reduced nighttime loss of heat.
If the hypothesis that there has been a truncation of the minima, rather than an upward shift of the whole distribution, is correct, then we should also expect that the years of the maximum minima should tend to be more recent than the years of minimum minima; and that the years for the maximum maximas should not tend to be more recent than those for the minimum maxima.
TABLE III – Summary of max/min's versus min/min's and max/max's versus min/max's over 12 months: Bellville 1866-1989
The entries are the number of days in each month.
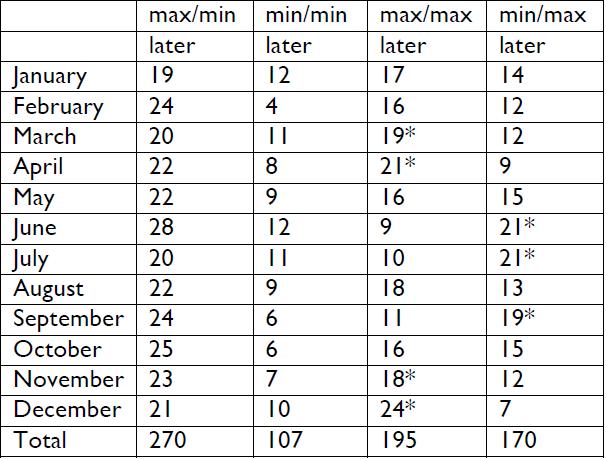
Table III presents the data for Belleville for max/min versus min/min, and max/max versus min/max.
The expectation is generally satisfied. The max/min's for all months are significantly more recent than the min/min's. A very different picture emerges for the maxima. Three of the min/max's are significantly later and four are significantly earlier. The alternative hypothesis that truncation of the minima rather than an upward shift of the whole distribution has occurred is further supported. Even a simple sign test supports the hypothesis that the shift is predominantly one of minima. Thus 11 of the 12 months have a higher proportion of days of more recent max/min than of max/max. Finally the year data show 270 days of more recent max/min, significantly greater than the 195 days of more recent max/max.
The Eastport data are presented in summary form in Table IV, showing the monthly data for the entire year.
TABLE IV – Number of Days of Temperature Extremes by Recency: Eastport January through December 1874-1990
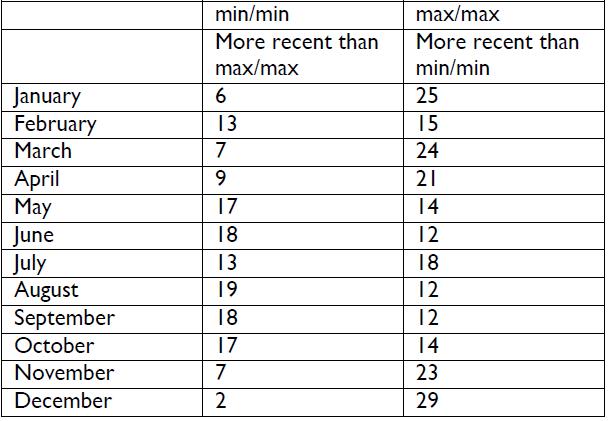
Of interest is the difference between the warm and the cold months. Eight of the cold months (not including January) show a pronounced asymmetry. Again, June, July and August show none at all. It would appear that there has been a truncation of extreme lows of the distribution but no corresponding extension of extreme highs. Thus it might be observed that winters are getting milder (as so many have suggested) and that summers (at least in eastern Maine) are pretty much as they have been.
Finally, Tables V and VI show the aggregate over three locations, to include Toronto, for the 120 day period; and over the whole year for Belleville and Eastport only. The differences for both are highly significant but those for the 120 day period are larger, as might be expected because this period was limited to the longest days of the year when night cooling would be most evident.
TABLE V – Summary data over all three locations for the first 120 days of the year. The entries are the number of days in the 120 day period and the number of years, N, of records.
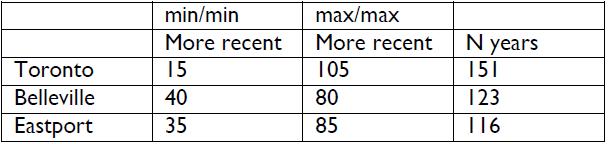
TABLE VI – Summary data over Belleville and Eastport locations for the whole year. The entries are the number of days in the year and the number of years, N, of records.
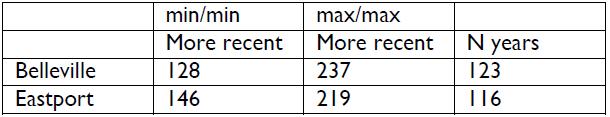
Discussion
The increase in mean global temperature over the last few decades is small. Why should the extremes present so strong a picture of warming? I hypothesize that if the distribution of temperatures is more or less normal, it is presumably so because of the existence of a relatively large number of factors, no one of which is dominant. One (or a few) of the many factors that can produce a small increase in mean temperature may have a more profound effect on the extremes. Thus a very small reduction of nighttime radiative losses would have a small effect on the daily means but would immediately appear in a truncation of the extreme lows of each 24 hour day. The data of the years of max/min and min/max at Belleville support the hypothesized min/min truncation explanation. It is clear that both the min/min's and the max/min's have risen but that the effect on the min/max is small and for some months in the reverse sense; i.e., the max/max is more remote than the min/max. It appears that more minima have been truncated than maxima have been extended, if the latter have been extended at all.
Conclusion
The data from 3 stations of northeastern North America - Toronto, Ontario; Belleville, Ontario; and Eastport, Maine - support the hypothesis that there has been a truncation of extreme low temperatures during the cooler days of the year. The most reasonable explanation is that there has been a reduction of nighttime losses of heat through radiation, perhaps as a consequent of increased atmospheric carbon dioxide. Mean daily temperatures will show little or no effect of small changes in extremes since that is the nature of distributions. The implications for agriculture and horticulture of a rise in the min/mins could be more dramatic than a minor increase or decrease in the mean temperatures, other things (e.g., snow cover) being equal, since winter kill is usually a consequence of extreme lows rather than of diurnal means. Similar effects will appear in an increase in the northern boundary of the ranges of animals. The possum observed in my back garden in Toronto recently supports my hypothesis.
Antarctica is a continent that fascinates even those of us who live near its Polar opposite, the Canadian Arctic, who think that we understand more than most people about cold and how to survive in such an extreme environment. Still, there is something distinctively different about the predominantly ice continent of Antarctica. It has fascinated people from the time even before it was “discovered,” when it was just a belief and a dream that there should be a southern continent because if there were one, its existence would provide a balance of the land masses on Earth.
The fact of its late discovery in the age of the explorers of the South Seas, surely played a role in Antarctica's taking on a mystique in the minds of Europeans. James Cook's voyage to discover a southern continent (should it exist) took him finally, in 1774, farther south than anyone had ever reached, to a position of 71° 10' south latitude and 106° 54' west longitude where his ship The Resolution sailed right to the outermost limit of the pack ice. The ship was only about 100 miles from Thurston Island and just opposite Marie Byrd Land but it could go no further because of the ice. Cook felt certain that they were close to the southern continent: “It was indeed my opinion as well as the opinion of most on board, that this Ice extended quite to the Pole or perhaps joined some land, to which it had been fixed from the creation….” (1).
Inaccessibility has been a major reason for the continued feeling that Antarctica is veiled in mystique. It is a continent surrounded by ice and water. It has always been a difficult continent to reach as ships must go through treacherous waters, and then face the possibility of running into pack ice and icebergs to reach the continent; flights by aircraft are limited to the summer season because of the severe cold and its devastating effect on transport vehicles. These access problems continue, even with 21st century technology.
Antarctica's inaccessibility meant that no indigenous peoples ever inhabited the continent, as far as the evidence reveals. Anthropology is the study of humans including their evolution and adaptation, both biological and cultural. Since there were no human cultures to study, anthropologists did not begin their research until much later than other scientific researchers. And when anthropologists did begin seeing potential for research, it was to specifically study human biological adaptability to extreme climatic conditions.
At the other polar region of the earth there were peoples with well developed cultural and biological adaptations living in the Arctic at least 20,000 years ago. These peoples are known to have originated in Asia, and they migrated from there across the Bering Land Bridge (in some areas as wide as 800 km) that connected Asia with North America. The seas are higher today and the Bering Strait of the Bering Sea separates Asia from North America. The peoples who migrated to the Arctic and successfully lived in it for thousands of years, attracted the attention of anthropologists. They wanted to study the behavioral and physical ways that enabled these people to successfully inhabit and survive in one of the most extreme cold environments on Earth. The Arctic and sub-Arctic drew anthropologists in a way that Antarctica never has.
Taking the polar contrasts further, we see that the severity of the environment of the Arctic and Antarctica differs in its effect on human survivability. The Arctic is more habitable for several reasons: (a) it is an area that consists of water surrounded by land and ice, whereas Antarctica is land and ice surrounded by water; (b) it is easier to reach because it is accessible on foot or sled from land points, thus making it unnecessary to use ships that must pass through cold or frozen seas; and (c) there is greater variety of natural resources and raw material including small and large mammals that humans can use for food, fuel, shelter and clothes.
Antarctica also has natural resources that can supply food and fuel, and possibly shelter and clothes, for human needs. Explorers' accounts describe their use of indigenous wildlife such as penguins, seals, fish, and birds to supplement their food supply. Even so, there is no evidence that any group of people ever chose to make Antarctica their home and establish a culture there.
The “peopling” of Antarctica began as a consequence of the International Geophysical Year (IGY) in 1956-57 which led to Antarctica's becoming a major focus of international scientific interest and research. Subsequently, twelve nations proposed the Antarctic Treaty of 1959, a unique cooperative venture among world nations, which set all sovereignty claims in abeyance, emphasized that the continent be used for peaceful purposes only, and dedicated it to international cooperation and scientific investigation. As of the early 21st century, forty-three nations have signed the Treaty.
Today on Antarctica, there are 18 nations operating 44 year-round stations. This provides a unique population on Antarctica which includes mainly scientists or support staff. They are involved in scientific research which is usually carried out from, or at, their home country's field stations. They are temporary “visitors” who use their home nations' field bases as their place of residence. They spend limited periods of time in Antarctica: either the summer season (December to the end of February), or a longer period of a year or at most two years.
This unique population in Antarctica provides an ideal opportunity for anthropologists to study short term human adaptability. This paper reviews the research in this area, and suggests ways in which Antarctica makes unique contributions to science in the area of human biology.
Antarctica and Human Biology
One of the first to recognize Antartica's significance for studying human biological adaptation was Edholm (2) who saw it as a unique area for carrying out research in adaptation both to extreme cold and to high altitude. The cold is ubiquitous and omnipresent, although Tikhomirov (3) emphasized that researchers must consider the different eco-zones when making comparisons in human biological responses. He distinguished three ecological zones in Antarctica including the hinterland, the coastal regions where the temperature is affected by the sea, and the high altitude plateau. The Russian field station of Vostok which is located at the magnetic South Pole sits at an altitude of 3500 m. The American station called the Amundson-Scott Base is located at the geographical South Pole and is 2835 m. in altitude. Both of these altitudes are high enough to require some period of acclimatization to the “thinner” air; both altitudes are within the upper range of human biological tolerance.
Edholm stated that “The isolated stations [throughout the Antarctic continent], inhabited by [usually] twenty men, provide microcosms of human society, greatly simplified in some respects but more representative than might be expected.” Expanding on this observation, he suggested that this situation provides exceptional advantages for research in Antarctica where the cultures of many nations practice science. Studying bio-behavioural responses in each cultural/national group can provide interesting data on the influence that cultural background has on one's bio-behavioural response to extreme cold.
Budd (4), for example, reported a scientific finding that showed a difference in metabolic rate change in winter responses comparing Japanese and Canadian men. The Japanese group showed increased metabolic rates over the winter, but this did not occur in the Canadians. Gunderson (5) reported other results from research done on Australians only, which found that there was a significant amount of within-group variation as revealed in body weight and skinfold measurements.
These results give rise again to the question of ethnic variation on biology, and also the question of the nature of variability itself among individuals of the same national background. Gunderson and others concluded that a study of variation amongst nationalities could provide additional understanding concerning human ecology, the study of human interaction with their environment, and human biological adaptability in Antarctica.
As a result of these earlier studies in the 1970s and the questions they raised about human adaptability to cold, a new research project was undertaken in the 1980s addressing human biological adaptation to cold. This International Biomedical Expedition to Antarctica (IBEA) was unique in being the first and only study carried out in Antarctica designed solely to investigate the human biological response to extreme Antarctic conditions.
Designing and carrying out any kind of scientific research in Antarctica have the usual problems of obtaining funding, setting up a research design and carrying out the research. In Antarctica, carrying out any research involves the additional factors of its geographical isolation and difficulty of accessibility, its limited field season, and its severe climate. In the present case, it took five years after the research was done, to analyse and publish the data (6), a little longer than usual, and some of the reasons will become obvious.
The participants in this research expedition, who functioned both as scientists and research subjects consisted of 12 men from five countries: Argentina, Australia, France, New Zealand and the United Kingdom. The study was designed to examine biological changes (acclimatization to the natural environment and acclimation in a laboratory setting) that occurred in men of different ethnic/national background living in a severely cold environment. Acclimation was defined as change brought about by exposure to a single variable, usually in a laboratory setting. Acclimatization was defined as functional compensation resulting from a related set of environmental factors.
Experiments were designed to investigate the following questions:
(1) Could acclimation to Antarctic conditions be enhanced through cold-induced experiments performed in a laboratory setting while in Antarctica?
(2) Could a short stay in Antarctica, with exposure to cold using modified technology, induce acclimatization?
(3) Do laboratory cold-induced tests produce similar results to actual exposure to cold? That is, could exposure to a single variable in a laboratory setting produce a similar kind of acclimatization that results from a multiple of environmental factors in a naturally cold setting?
The laboratory tests included the following:
(a) Whole body exposure to 10° C cold while the participant was minimally clothed. Continuous temperature monitoring was taken rectally and at 12 skin locations. Oxygen consumption was measured every 15 minutes; systemic arterial blood pressure was measured every 10 minutes. In these cold air tests, subjects showed a slight reduction in oxygen consumption and a slight increase in digital and neck temperatures. These results suggest a slight acclimation in BMR (basal metabolic rate) and an ability to adapt by enhanced vasodilation.
(b) Whole body immersion (except head) in water at 15° C for up to an hour, with constant monitoring using thermisters to record skin and rectal temperatures. Information was gathered for 10 immersions for each participant, and this was compared with controls who did not undergo the cold water immersions. Normal internal body temperature is 37° to 38° C, and any fall below 35° C was cause to stop the experiment and remove the participant to a warm water bath where the water was gradually heated from 34° to 40° C. Heart rate and ECG were also monitored during the entire immersion; oxygen consumption was measured for five minutes every 15 minutes before and during immersion. The results showed that few of the participants were able to remain immersed for the full hour, and that longer immersion closer to an hour was individually variable. The general conclusion was that the cold baths reduced the shivering response which resulted in saving body energy, while using more body heat through increased oxygen consumption and increased heart rates. Body build, whether slimmer or heavier, affected the amount of shivering respectively from greater to less.
(c) Facial immersion was endured for three minutes in water at 5° C, with the use of a snorkel to breathe. Monitoring was done for ECG and forehead temperature with thermistors. The results revealed that after several tests, the participant showed less change in heart rate and a greater ability to maintain skin temperature toward normal, thus suggesting a tendency toward acclimation.
(d) Peripheral body cooling was examined by immersing one finger into stirred water at 0° C for 30 minutes where skin temperatures were measured every 30 seconds. This test was to record induced vasodilation. The immediate response was vasoconstriction, followed by vasodilation, and then afterwards there were fluctuations between the two. The results showed adaptive changes in that the differences between minimum and maximum skin temperatures during testing was significantly smaller with increased number of exposures to cold water. Also, after the third test, the level of the skin temperature during the test was consistently lower, suggesting acclimation.
Theoretically, this was a very well designed study. The results suggest that laboratory-induced acclimation enhances overall cold adaptation in the natural environment. It also showed that a short stay in Antarctica, in this case 71 days, induces acclimatization to cold and that the participants were better adapted to cold at the end of the research than at the beginning. The men participating in this project themselves stated that the climatic conditions, severe cold and laboratory experiments were not a cause of stress or maladaptation.
After the completion of the study, the group met and discussed the research design and the results. Ironically, each individual admitted to having felt dissatisfaction with his participation in both the laboratory experiments and the field phase of the project. All of the men had resented the fact that at one point they were controlling the laboratory experiment on a colleague, and then they became the participant. They felt that this role reversal made them more vulnerable to the whims of one who had previously been in their position. This led them to question why they should push themselves to extreme discomfort in such a situation. As a result, they performed at an acceptable level but one which might have been below their abilities. There would of course have been more leeway for reduced performance among the stronger and fitter participants than among the less fit ones who would have had to have reached a certain level of performance requiring more relative effort from them.
The same admission was made for the field phase of the study. Why work really hard and push themselves when their partner would be changing at the end of two weeks and when no bonding had occurred, partly because of poor communication in speaking different languages and partly because of different cultural and national backgrounds? Again, those who might have had more capability to perform better, did only the minimal or moderate amount necessary in the context of the experiment.
As a result, although there were differences in the size, strength, endurance and fitness levels of the participants, those who were physically stronger and more capable performed acceptably, but not at the levels at which they might have been capable. None of the participants pushed themselves to a level they might have been able to have achieved in their performance in the experiments, had they have felt more enthusiastic about the project.
The psychological response of the participants in the study was found to be “basically and exactly identical in all cases,” and the human factor in these extreme conditions revealed that he who is more able, does less (6). This bio-behavioral response of the group was indeed one of the most fascinating of the conclusions as it shows how ones mental state can affect ones physical responses.
What are the reasons for these results and how can the circumstances that led to them have been prevented? An analysis of the causes that led to this finding may provide valuable data both to future work in Antarctica, and to other situations of contrived settings where people are placed in extreme conditions and must co-operate and function together to survive, as in submarines, space ships, space stations, or other similarly closed, limited or isolated situations.
The following suggestions are made regarding the circumstances that might have been responsible for the lack of bonding and the failure of the group to work together as a team: (a) Team selection based primarily on scientific skills rather than on ability to work or act as a participant on an Antarctic research team. (b) Being required to play a dual role of researcher and research subject. (c) Randomly grouping two men together for two weeks, and then changing the pairs on a regular basis. (d) Being in a situation of voluntary isolation for 71 days during which the individuals were separated geographically, emotionally and socially from their normal place and way of living. (e) Being a member of a group representing five nationalities with different customs, behaviour, and language.
At the end of the research project, all of the participants agreed that they had found it tedious and that they had not worked together as a team. The research design had not taken into consideration that the assembled group of people, primarily scientists each with individual goals, had little or nothing in common with each other, from nationality to language to common focus. In this isolated, “closed” group of men studying adaptation to cold, there was no bonding and no common goal other than cold itself, and consequently each person's individuality was the primary focus.
In contrast, when we look at Ernest Shackleton's 1914-15 expedition (6) to cross the entire land mass of Antarctica, we see a group of individuals bonded by a common goal, a belief in the importance of what they were doing, and a perseverance through will and belief in their leader even at what might have been a final tragedy after their ship was crushed by the ice and they were stranded on Elephant Island in Antarctica. Shackleton's remarkable 800 mile journey in a small boat with six others of his hand-picked group, across the Weddell Sea over some of the most treacherous waters to reach South Georgia Island, and then to return to save the rest of his men, is testimony to the fact that “It is man's intellect and behavior that is the important element in survival in adverse climates.” (4).
In conclusion, I would like to summarize the value of research on human biological, including bio-behavioral research, on short-term residents of Antarctica.
1. Antarctica is a unique meeting ground for science without political boundaries, thus enabling human adaptability research on location involving different national groups, and now different genders.
2. It provides information about the nature of short term cold adaptability.
3. It is useful as a model for contrived circumstances that place people together where it is critical that they interact and work together in a closed or semi-closed, isolated environment where they must cooperate and function successfully for their survival, as in submarines, space shuttles and orbital stations.
4. Antarctica is a special environment where the “human” element can be studied in group behavior, and in individual adaptation, to isolated, semi-closed, potentially lethal environments.
References
1. Landis, M. J. Antarctica: Exploring the Extreme, 400 Years of Adventure. Chicago Review Press 2001.
2. Edholm, O.G. and E.K.E. Gunderson 1973. Polar Human Biolog. Proc. of the SCAR/IUPS/IUBS Symposium on Human Biology and Medicine in the Antarctic.
3. Tikhomirov, I.I. 1973. The main trends of Soviet medical investigations in Antarctica, In Edholm, O.G. and E.K.E. Gunderson Polar Human Biology. Proc. of the SCAR/IUPS/IUBS Symposium on Human Biology and Medicine in the Antarctic, pp. 41-47.
4. Budd, G.M. 1973. Australian physiological research in Antarctica and Sub-Antarctica with special reference to thermal stress and acclimatization, In Edholm, O.G. and E.K.E. Gunderson, eds. Polar Human Biology. Proc. of the SCAR/IUPS/IUBS Symposium on Human Biology and Medicine in the Antarctic, pp. 15-40.
5. Gunderson, EKE (ed). Human Adaptability to Antarctic Conditions. American Geophysical Union, Washington DC. 1974.
6. Rivolier, J, R. Goldsmith, D.J. Lugg, A.J.W. Taylor 1988. Man in the Antarctic: Scientific work of the International Biomedical Expedition to Antarctica (IBEA).
7. Shackleton, Ernest South: The Endurance Expedition. Heinemann, London 1919 (reprinted 1936).
END